编程语言流行度环形图
中文完整提示词
一张方形数据可视化图,呈现 2025 虚构开发者调查的多层环形图。深石墨色背景,淡点阵。两层同心环:外环按十种语言色块分段,并标百分比 「JavaScript 28%」、「Python 24%」、「TypeScript 14%」、「Java 9%」、「C# 6%」、「Go 5%」、「Rust 5%」、「Kotlin 4%」、「Swift 3%」、「Other 2%」。内环以更细字按范式分组:「Web」、「Data and ML」、「Systems」、「Languages Devs Actually Used, 2025」。右上角图例每行配色块与小箭头(升、降、平)。环上方标题 「编程语言流行度环形图」,下方一行 "Source: fictional survey, n = 12 480"。几何无衬线,百分比用等宽数字对齐,配色青、品、青柠、琥珀、紫,分段两像素细线。
English full prompt
A square data-visualization tile showing a multi-layer ring chart of programming language popularity for a fictional 2025 developer survey. Dark graphite background, faint dot grid. The chart has two concentric rings. The outer ring is divided into ten color-coded segments labelled with language names and percentage: "JavaScript 28%", "Python 24%", "TypeScript 14%", "Java 9%", "C# 6%", "Go 5%", "Rust 5%", "Kotlin 4%", "Swift 3%", "Other 2%". The inner ring groups them by paradigm with thinner labels: "Web", "Data and ML", "Systems", "Mobile". A clean key at the top-right lists each language with a color swatch and a tiny trend arrow (up, down, flat). The headline above the rings reads "Languages Devs Actually Used, 2025". Below the rings, a single line of source attribution reads "Source: fictional survey, n = 12 480". Typeface is a precise geometric sans-serif, all percentages aligned in tabular figures, color palette built from cyan, magenta, lime, amber, violet against the dark base, two-pixel separators between ring segments.
相关案例
-
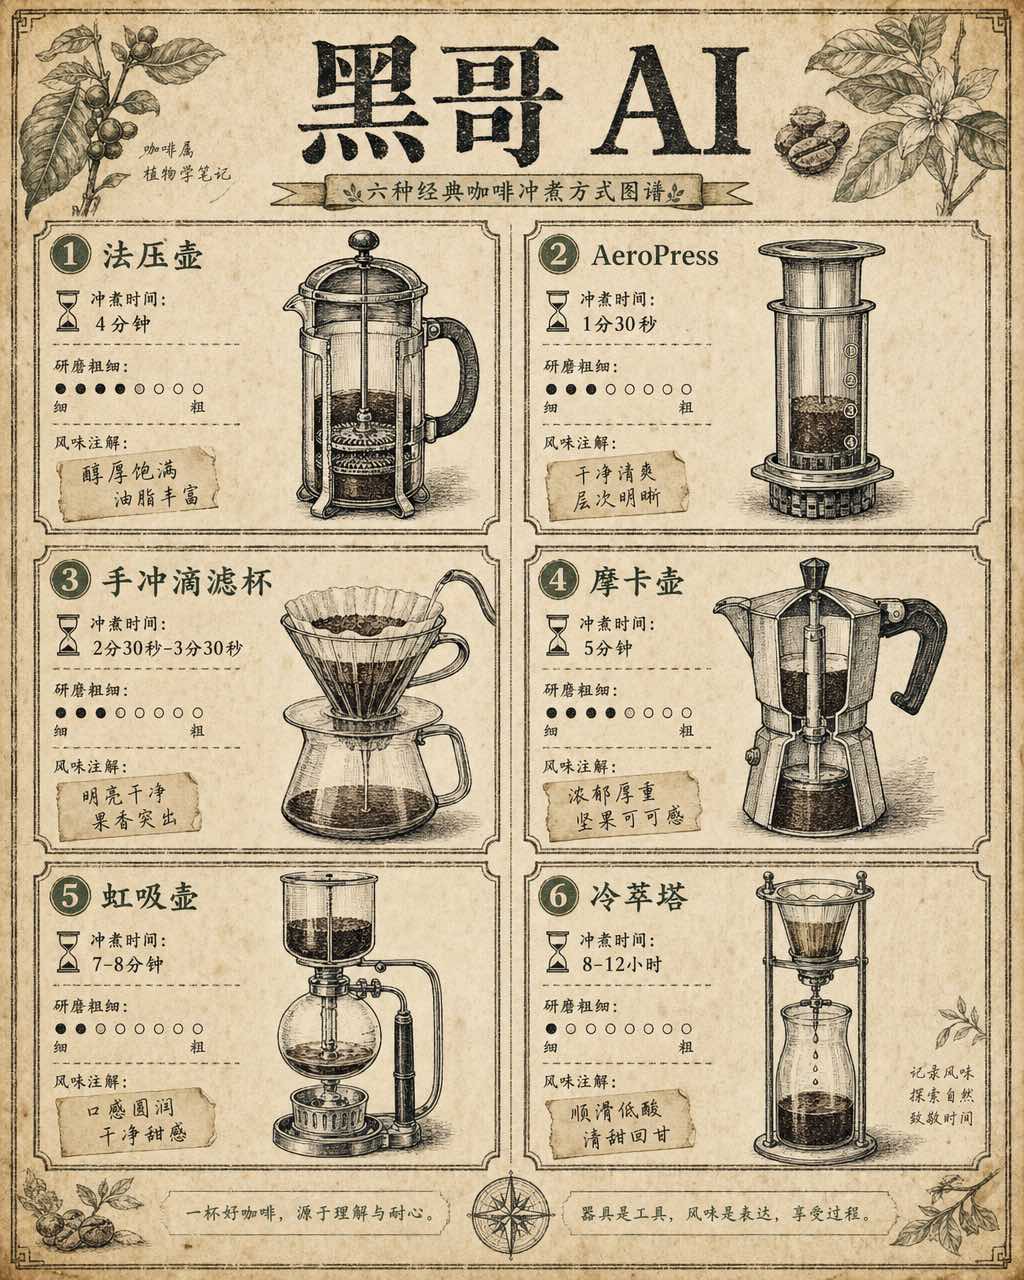
咖啡冲煮方式对比图
一张复古百科全书风格的信息图,在米白色做旧纸张上以两列网格排列六种咖啡冲煮方式对比。每个格子内有手绘钢笔风格剖面插图——法压壶、AeroPress、手冲滴滤杯、摩卡壶、虹吸壶、冷萃塔——配精细交叉阴影线增加立体感。每个设备下方以三行列出:冲煮时间(沙漏图标+文字)、研磨粗细(粗细刻度点)和风味注解(手写标签如 「bo…
-
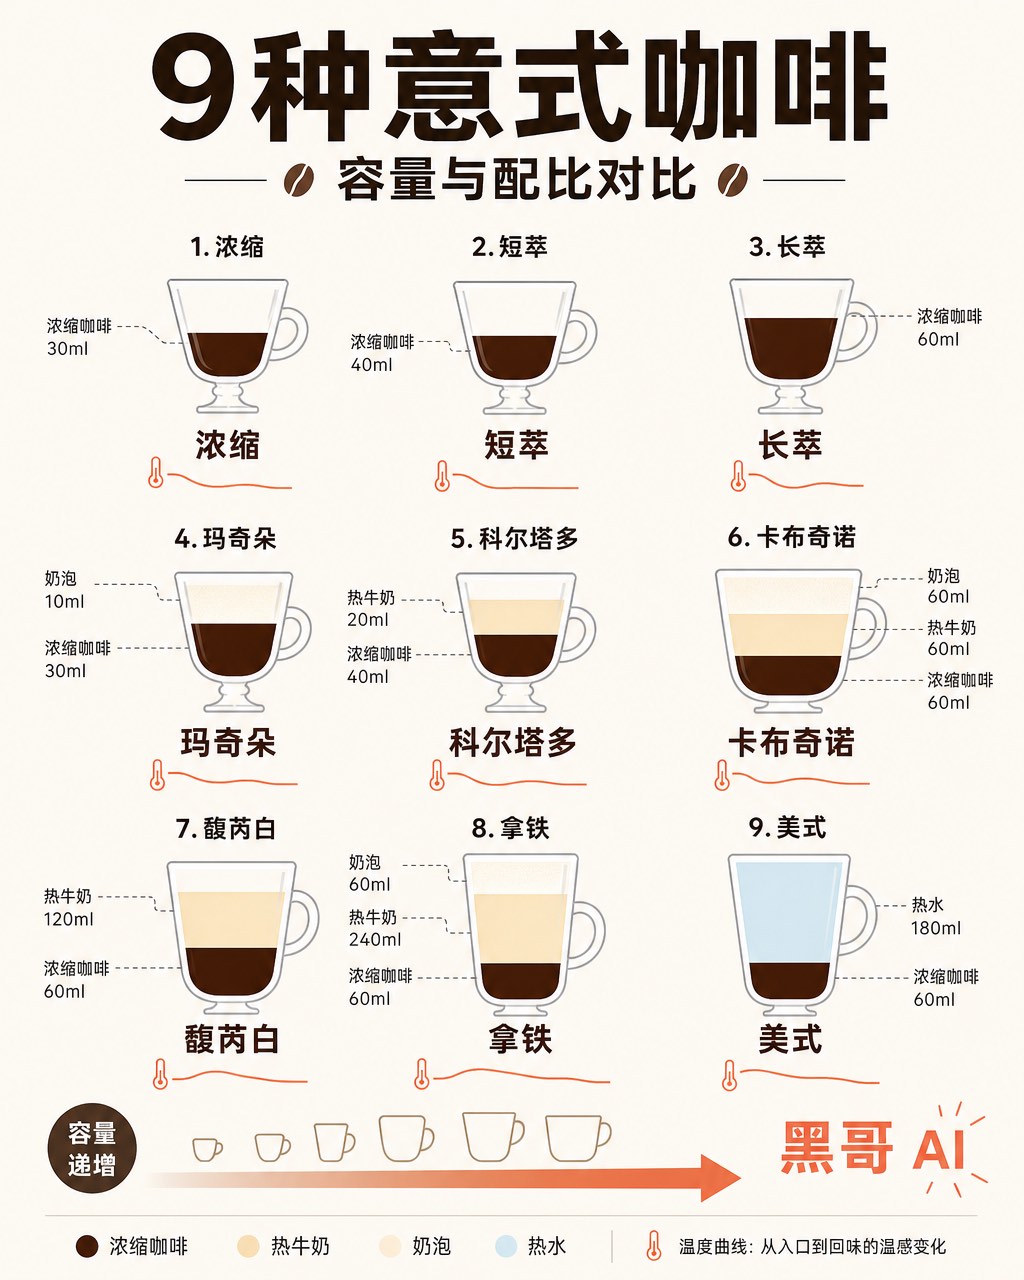
意式浓缩饮品配比示意图
一张简洁扁平风格信息图,将九种意式咖啡饮品——espresso、ristretto、lungo、macchiato、cortado、cappuccino、flat white、latte、americano——以高脚杯/咖啡杯轮廓横排展示。每个容器内用分层色块表示浓缩咖啡(深棕)、牛奶(暖奶油)、奶泡(浅象牙)和水(…
-
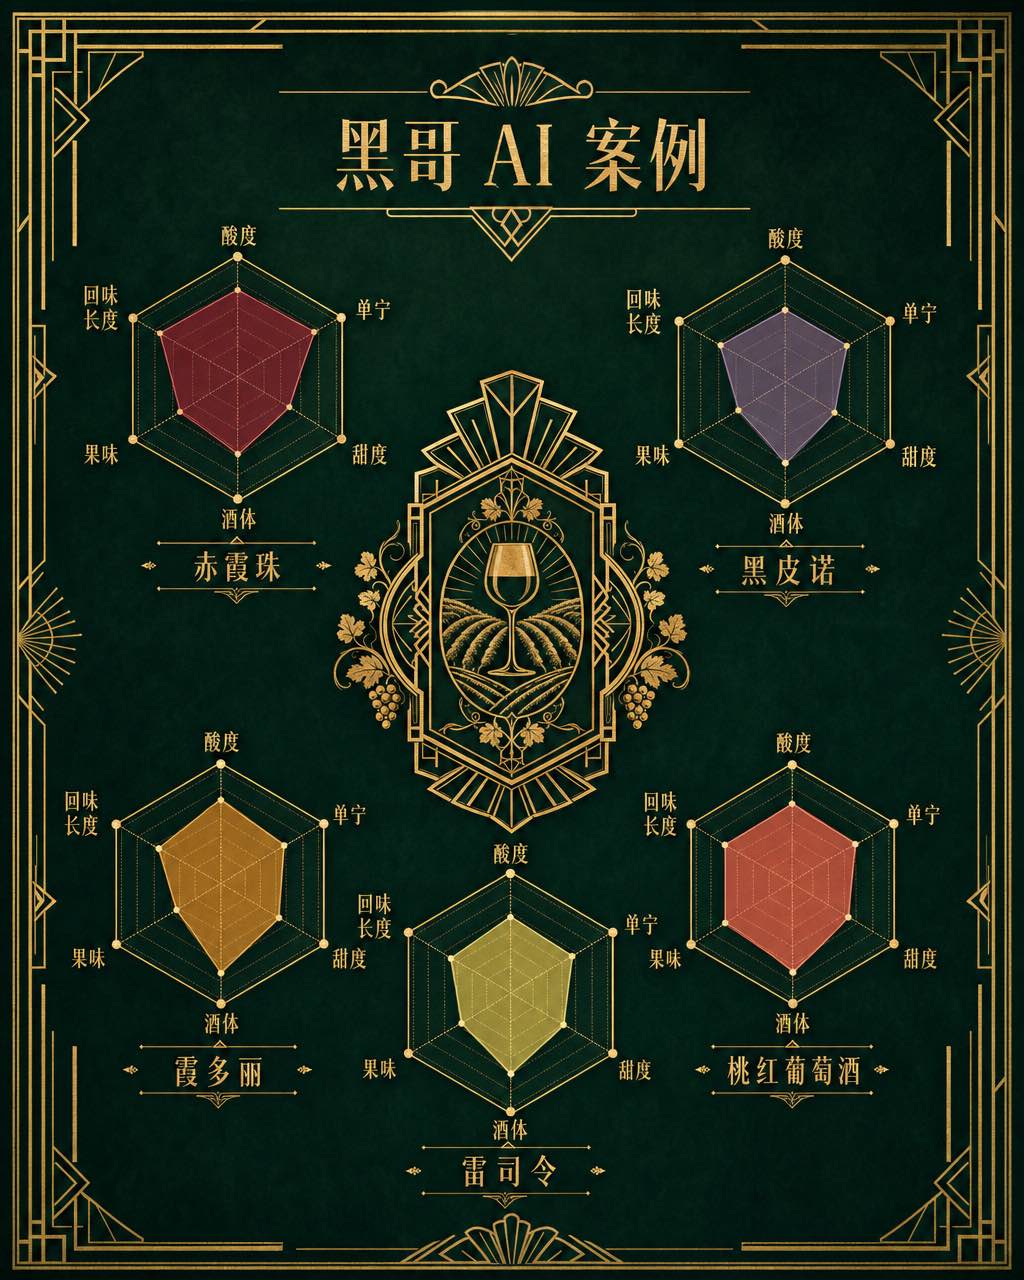
葡萄酒风味雷达图
一张装饰艺术风格的葡萄酒风味雷达图海报,展示五款经典葡萄酒:Cabernet Sauvignon、Pinot Noir、Chardonnay、Riesling 和 Rosé 的味觉雷达图。五个六边形雷达图对称排列在中央装饰徽章周围。每个雷达图有六条轴线——酸度、单宁、甜度、酒体、果味、回味长度——填充半透明多边形展示…
-
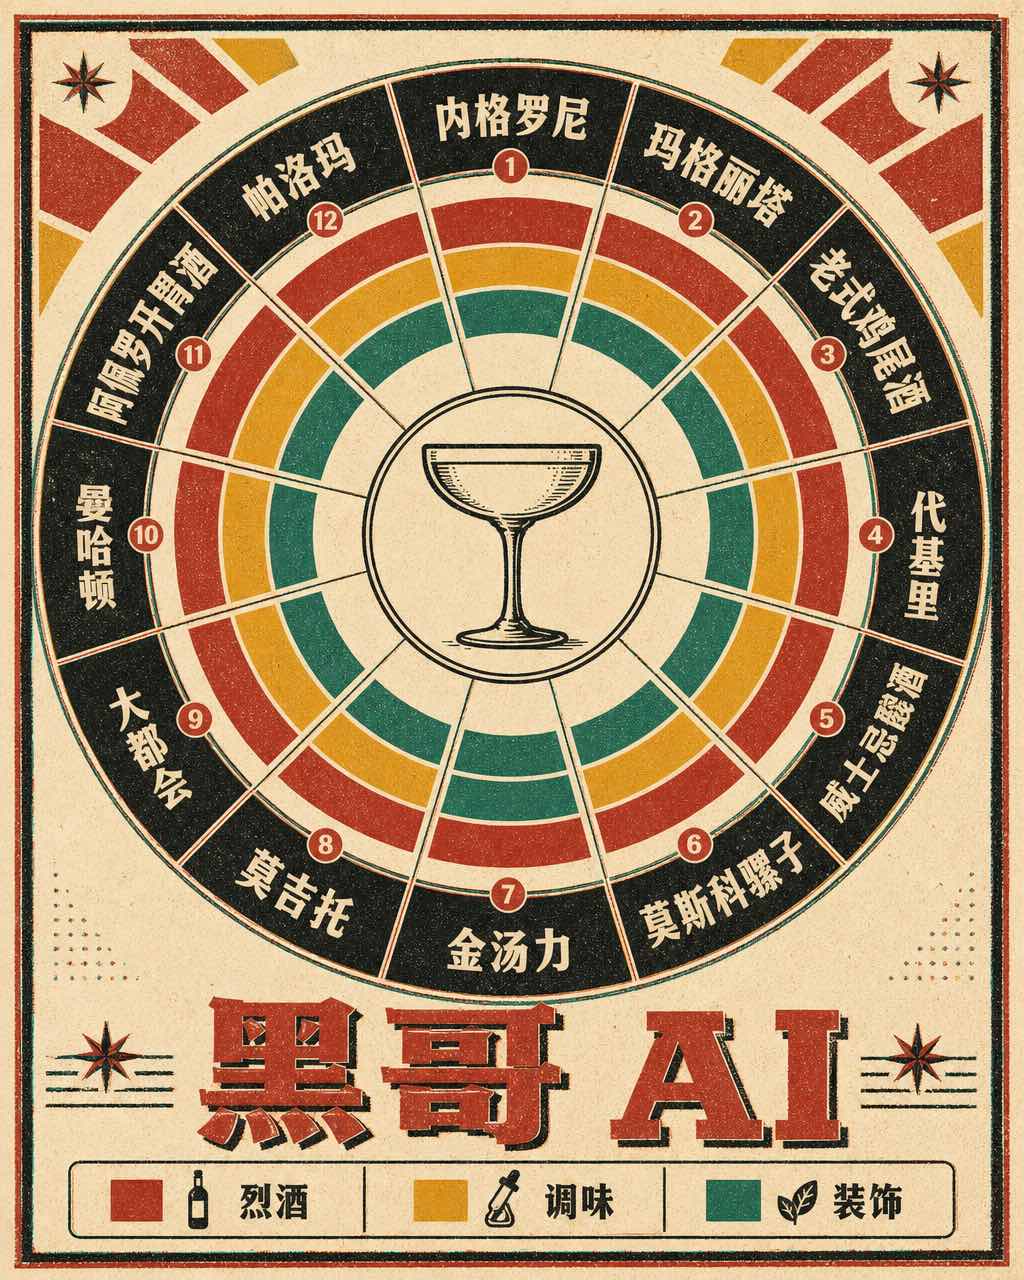
经典鸡尾酒配比转盘图
一张复古1960年代风格的圆形鸡尾酒配比转盘图,印在暖象牙色卡纸上,使用大胆的胶版印刷色彩。转盘分为十二个放射形扇区,每个代表一款经典鸡尾酒:Negroni、Margarita、Old Fashioned、Daiquiri、Whiskey Sour、Moscow Mule、Gin & Tonic、Mojito、Cos…