Personal Carbon Footprint Breakdown Diagram
English full prompt
A striking flat-design infographic breaking down the average personal annual carbon footprint into seven categories, designed as a central bubble map on a deep forest green background. A large central circle labeled "Annual Carbon Footprint: 8.5t CO₂e" is surrounded by seven satellite bubbles scaled proportionally by carbon impact: Transport (2.4t), Home Energy (1.9t), Food (1.6t), Shopping (1.1t), Flights (0.7t), Digital (0.5t), and Other (0.3t). Each bubble has a distinct earthy or ecological flat color: burnt orange for Transport, warm yellow for Home Energy, leaf green for Food, sky blue for Shopping, cloud grey for Flights, electric teal for Digital, and stone beige for Other. Thin connecting lines radiate from the center. Each bubble shows its label, tonnage, and a minimal 1-line reduction tip in white italic type. The background has a subtle halftone dot texture. Bottom strip shows a comparison bar: this footprint vs global average vs 2030 target.
中文完整提示词
一张醒目扁平设计信息图,将个人年均碳足迹分解为七个类别,以中央气泡图形式呈现在深森林绿背景上。中央大圆圈标注 「个人碳足迹构成分解图」,周围七个卫星气泡按碳排放比例缩放:交通(2.4t)、家庭能源(1.9t)、食物(1.6t)、购物(1.1t)、航班(0.7t)、数字设备(0.5t)、其他(0.3t)。每个气泡有独特生态配色:焦橙(交通)、暖黄(能源)、叶绿(食物)、天蓝(购物)、云灰(航班)、电光青(数字)、石米(其他)。细连接线从中心辐射。每个气泡显示标签、吨数和一行白色斜体减排建议。背景有细微半调点阵纹理。底部横条展示此碳足迹与全球均值、2030目标的对比。
Related cases
-
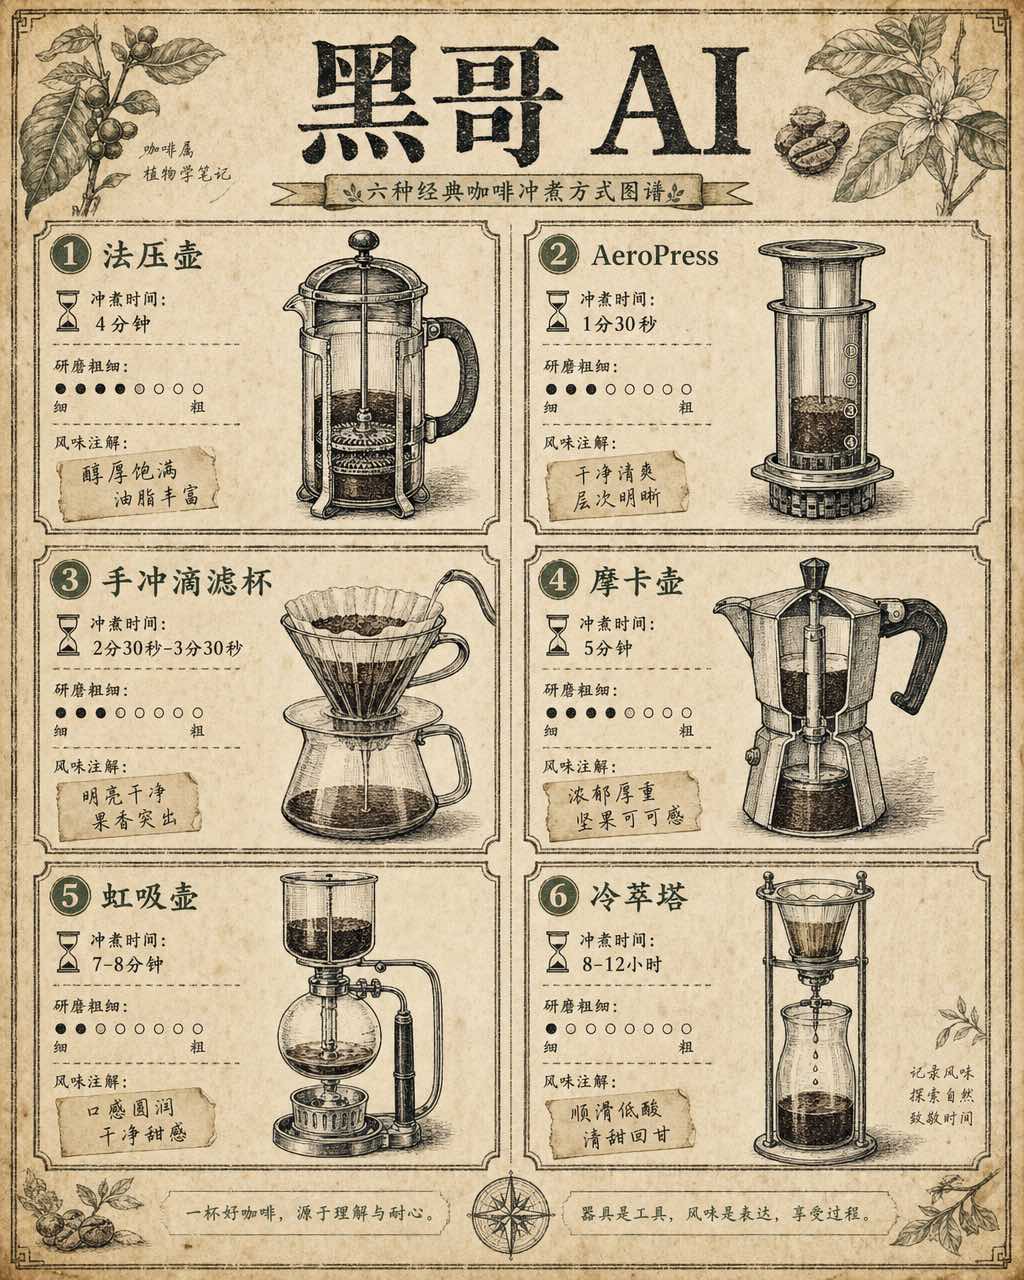
Coffee Brewing Methods Comparison Chart
A vintage-encyclopedia-style infographic comparing six coffee brewing methods arranged in a two-column grid on aged cream paper. Each cell contains a hand-inked cross-section illu…
-
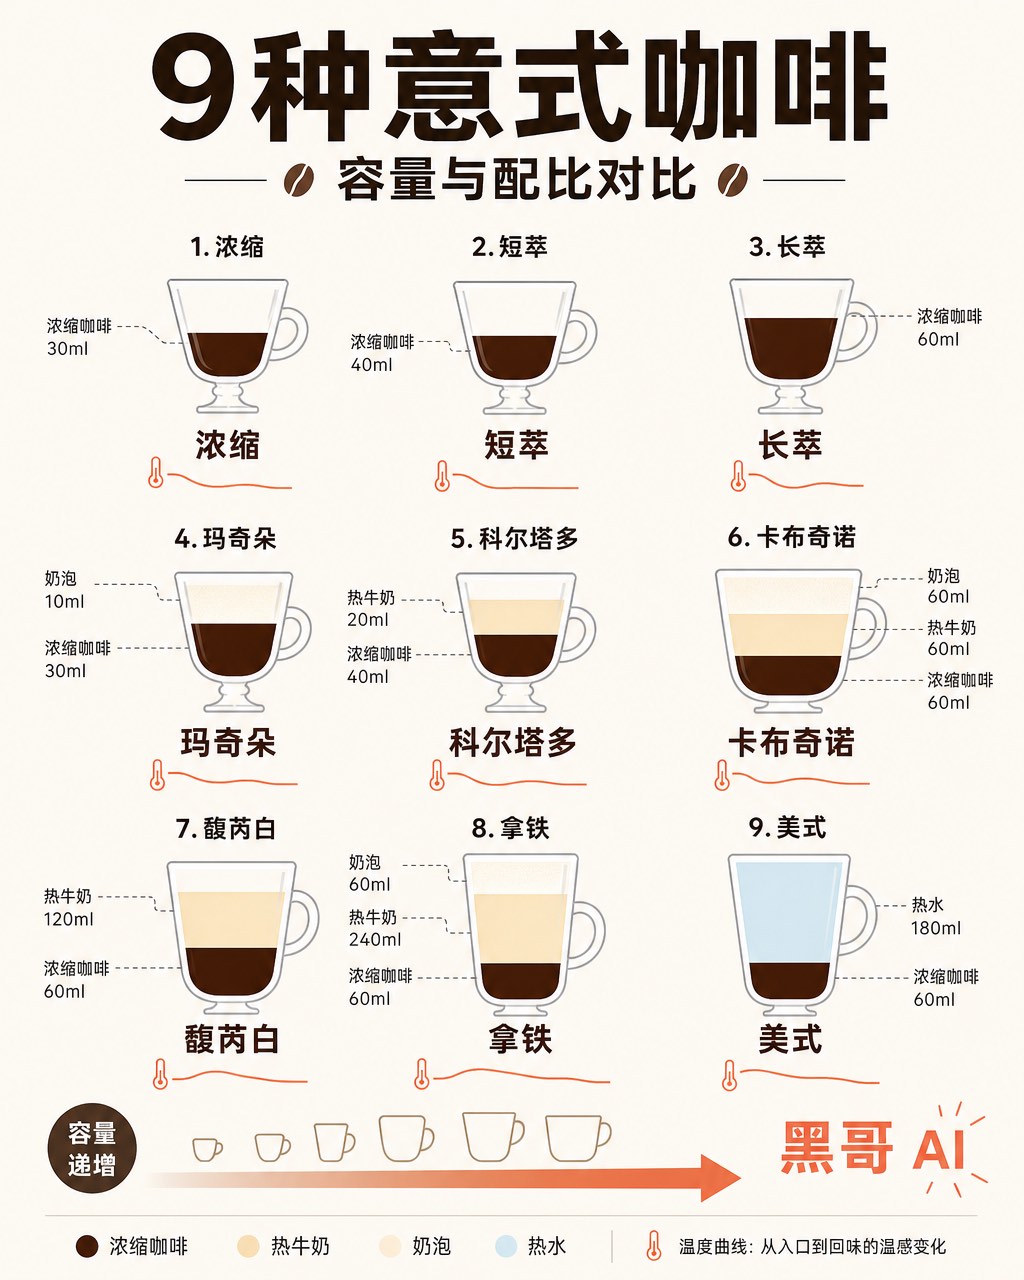
Espresso Drink Ratios Diagram
A clean flat-design infographic illustrating nine espresso-based drinks — espresso, ristretto, lungo, macchiato, cortado, cappuccino, flat white, latte, and americano — as tall ve…
-
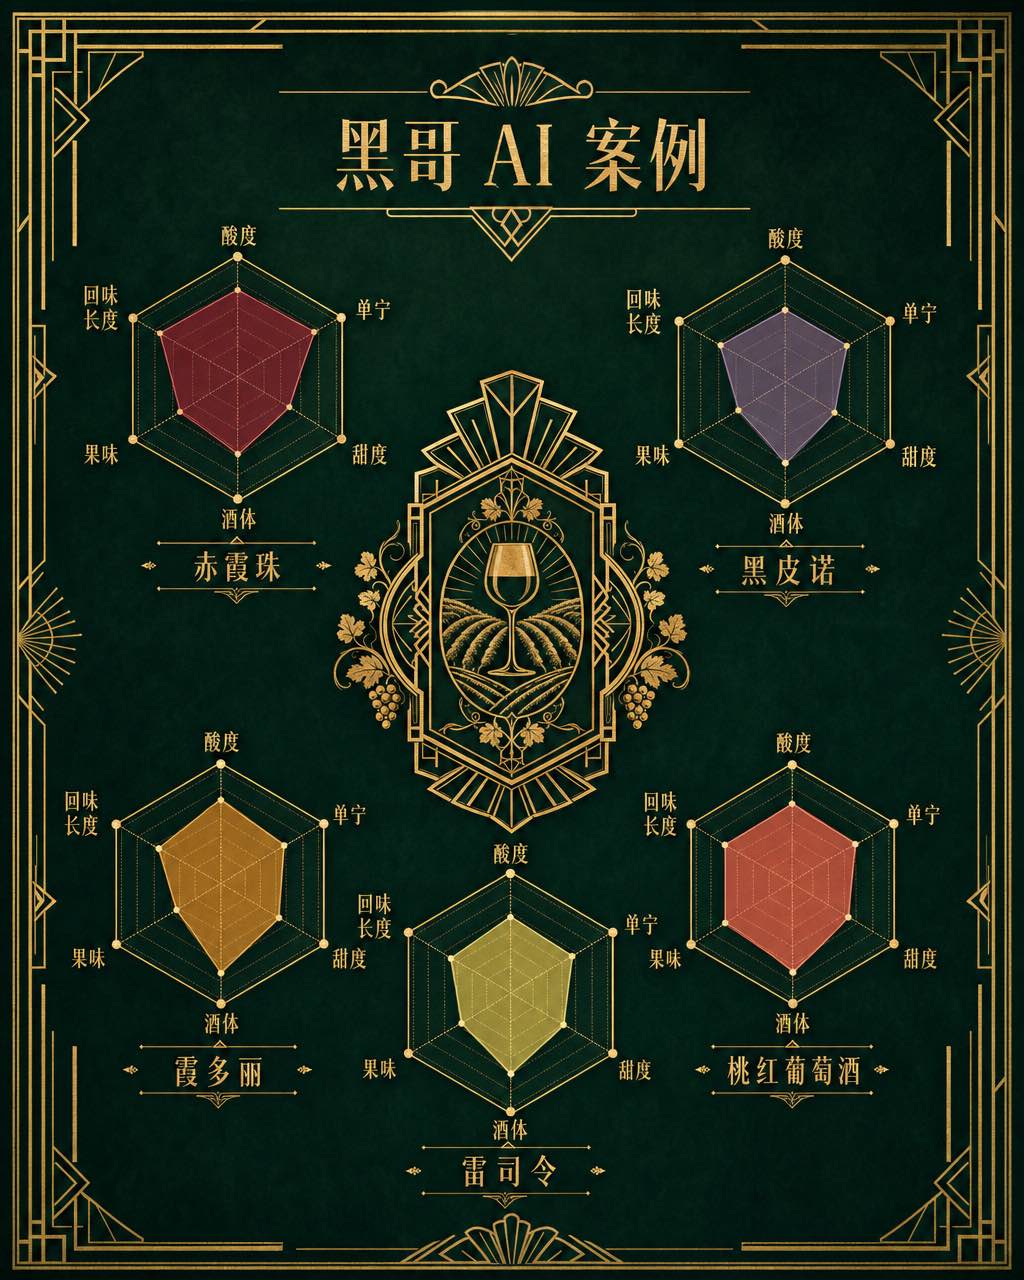
Wine Taste Profile Radar Chart
An art-deco-inspired infographic poster presenting taste-profile radar charts for five classic wines: Cabernet Sauvignon, Pinot Noir, Chardonnay, Riesling, and Rosé. The five hexa…
-
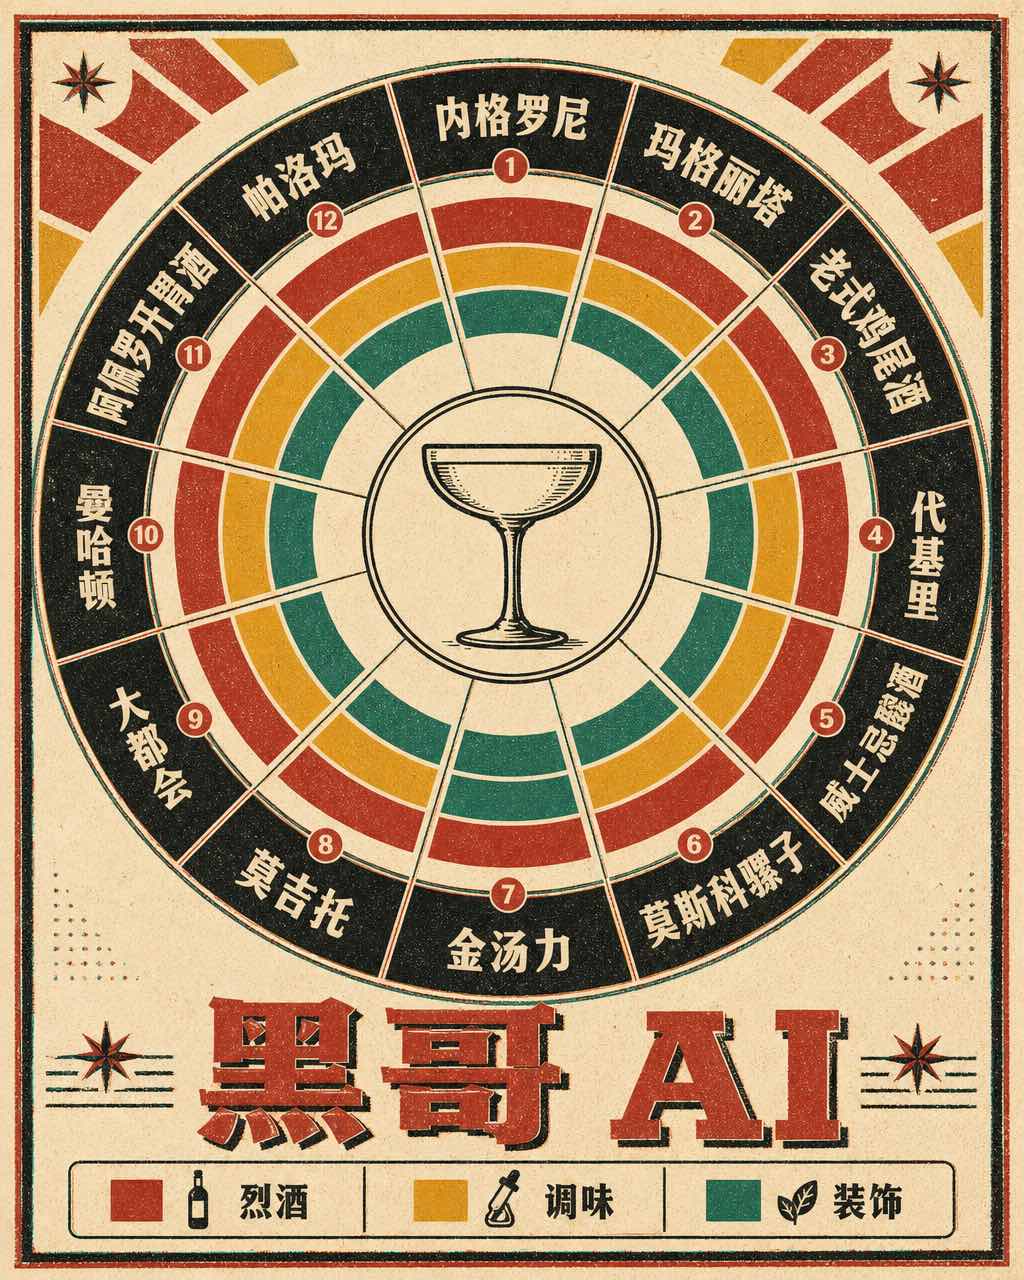
Classic Cocktail Mixing Ratios Wheel
A retro 1960s-style circular infographic — a cocktail mixing ratio wheel — printed on warm ivory card stock with bold offset-printing colors. The wheel is divided into twelve radi…