个人碳足迹构成分解图
中文完整提示词
一张醒目扁平设计信息图,将个人年均碳足迹分解为七个类别,以中央气泡图形式呈现在深森林绿背景上。中央大圆圈标注 「个人碳足迹构成分解图」,周围七个卫星气泡按碳排放比例缩放:交通(2.4t)、家庭能源(1.9t)、食物(1.6t)、购物(1.1t)、航班(0.7t)、数字设备(0.5t)、其他(0.3t)。每个气泡有独特生态配色:焦橙(交通)、暖黄(能源)、叶绿(食物)、天蓝(购物)、云灰(航班)、电光青(数字)、石米(其他)。细连接线从中心辐射。每个气泡显示标签、吨数和一行白色斜体减排建议。背景有细微半调点阵纹理。底部横条展示此碳足迹与全球均值、2030目标的对比。
English full prompt
A striking flat-design infographic breaking down the average personal annual carbon footprint into seven categories, designed as a central bubble map on a deep forest green background. A large central circle labeled "Annual Carbon Footprint: 8.5t CO₂e" is surrounded by seven satellite bubbles scaled proportionally by carbon impact: Transport (2.4t), Home Energy (1.9t), Food (1.6t), Shopping (1.1t), Flights (0.7t), Digital (0.5t), and Other (0.3t). Each bubble has a distinct earthy or ecological flat color: burnt orange for Transport, warm yellow for Home Energy, leaf green for Food, sky blue for Shopping, cloud grey for Flights, electric teal for Digital, and stone beige for Other. Thin connecting lines radiate from the center. Each bubble shows its label, tonnage, and a minimal 1-line reduction tip in white italic type. The background has a subtle halftone dot texture. Bottom strip shows a comparison bar: this footprint vs global average vs 2030 target.
相关案例
-
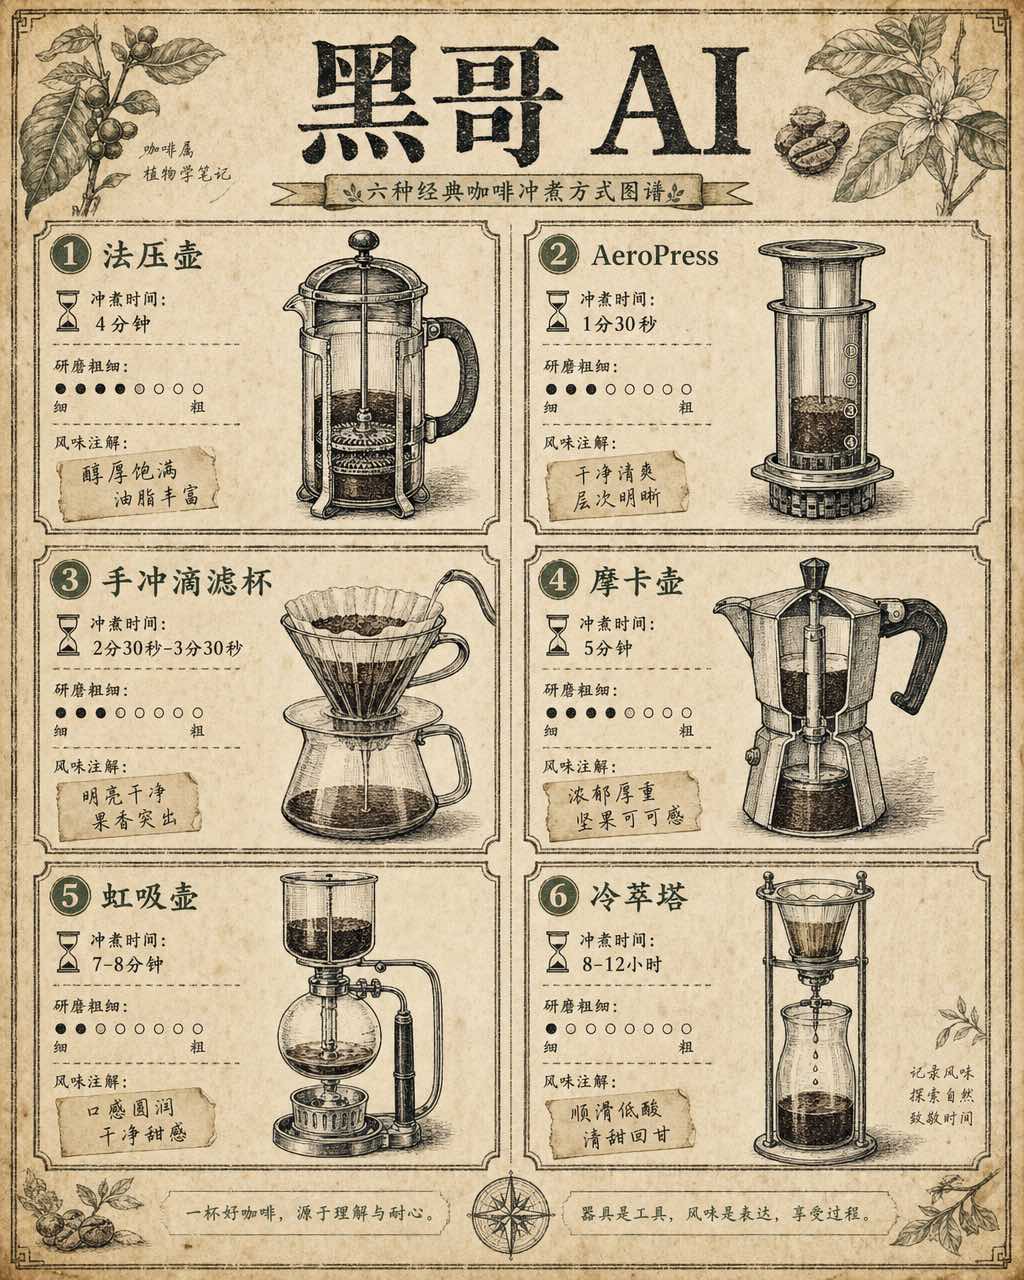
咖啡冲煮方式对比图
一张复古百科全书风格的信息图,在米白色做旧纸张上以两列网格排列六种咖啡冲煮方式对比。每个格子内有手绘钢笔风格剖面插图——法压壶、AeroPress、手冲滴滤杯、摩卡壶、虹吸壶、冷萃塔——配精细交叉阴影线增加立体感。每个设备下方以三行列出:冲煮时间(沙漏图标+文字)、研磨粗细(粗细刻度点)和风味注解(手写标签如 「bo…
-
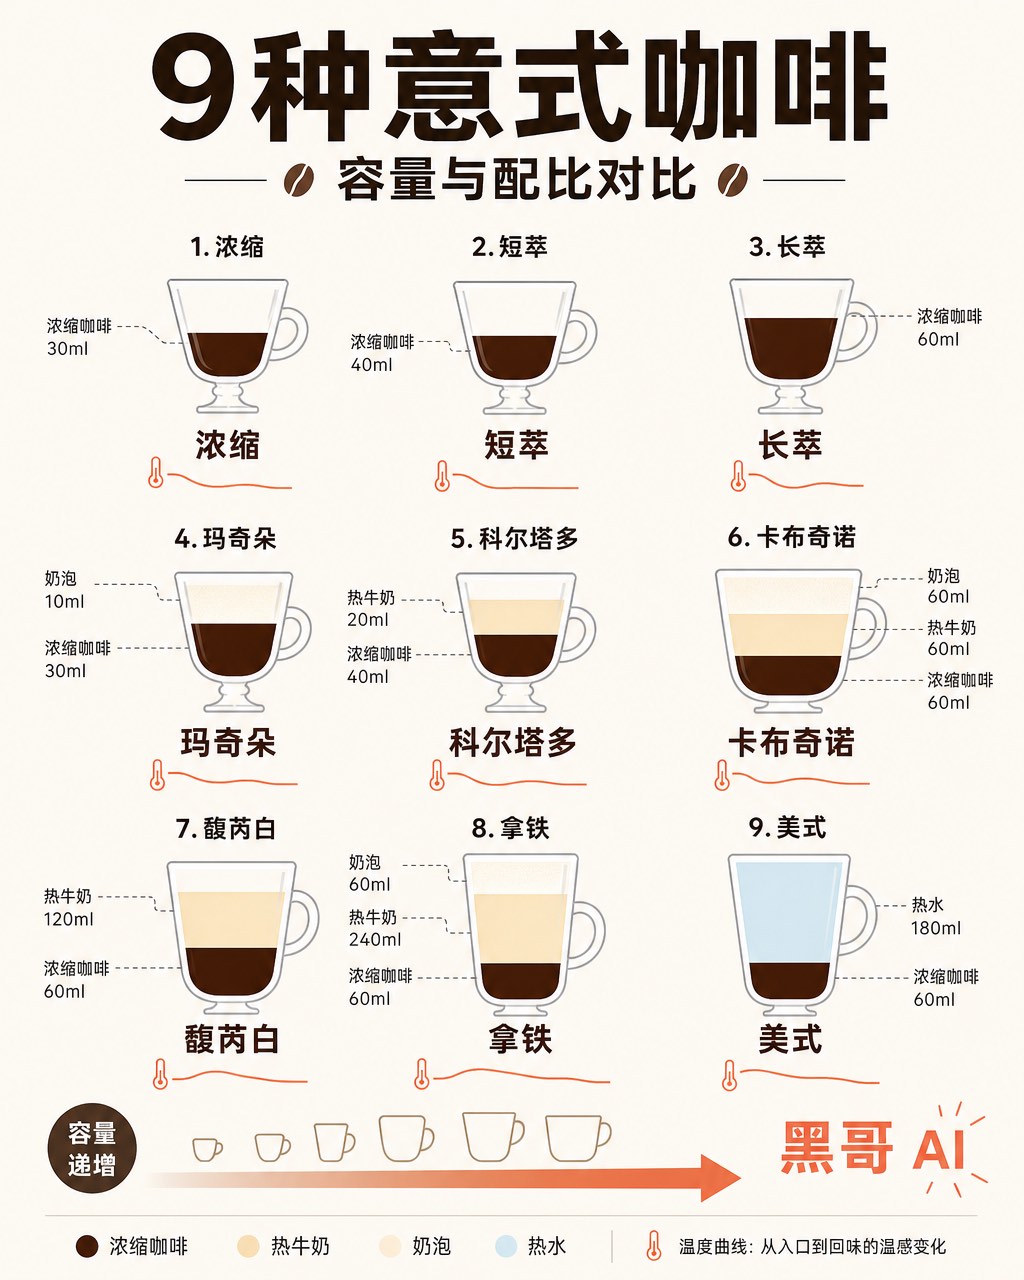
意式浓缩饮品配比示意图
一张简洁扁平风格信息图,将九种意式咖啡饮品——espresso、ristretto、lungo、macchiato、cortado、cappuccino、flat white、latte、americano——以高脚杯/咖啡杯轮廓横排展示。每个容器内用分层色块表示浓缩咖啡(深棕)、牛奶(暖奶油)、奶泡(浅象牙)和水(…
-
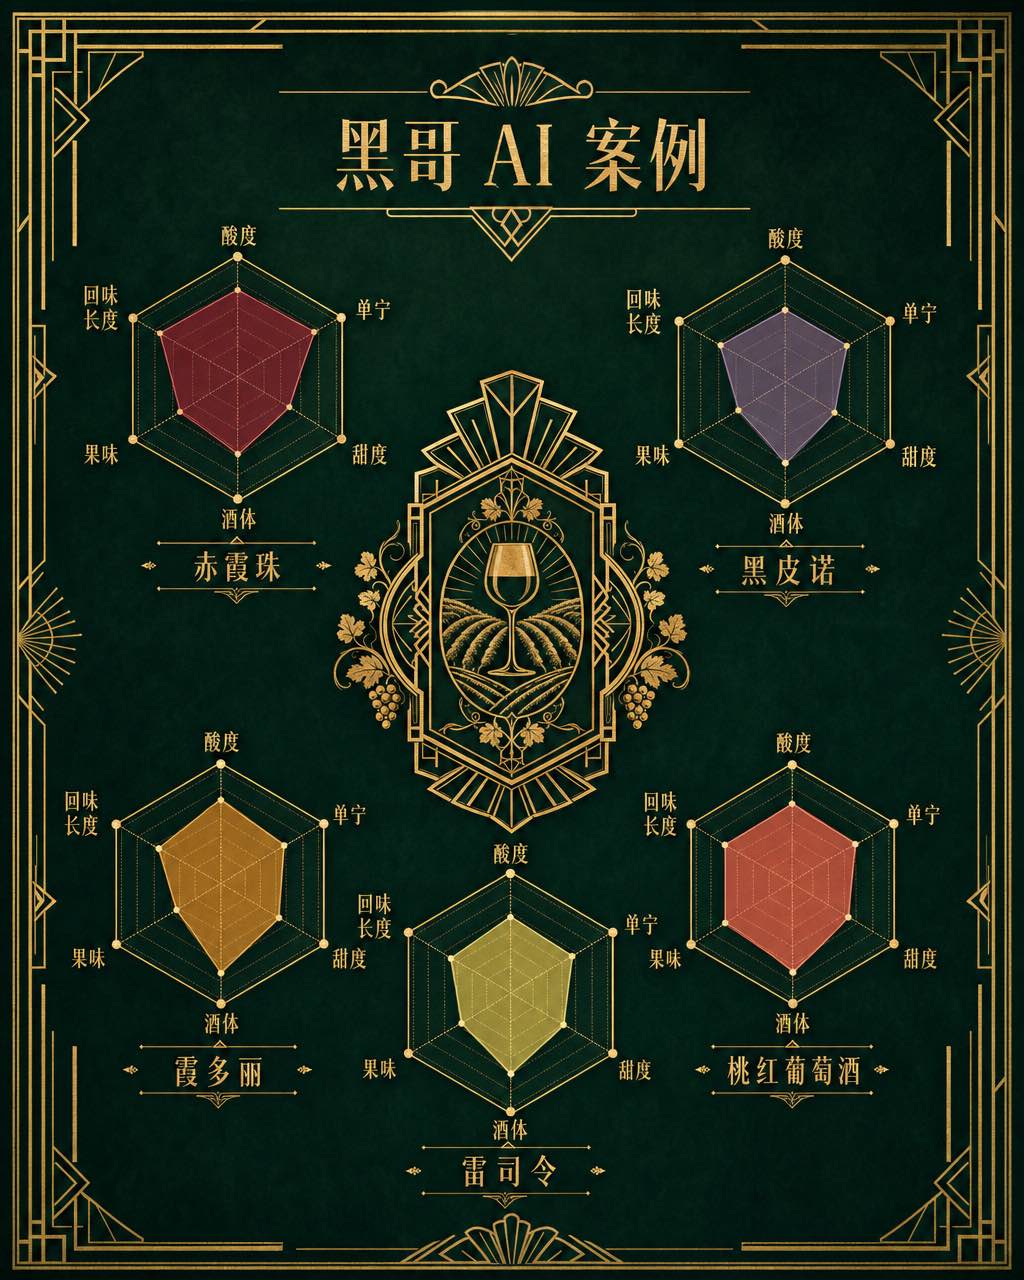
葡萄酒风味雷达图
一张装饰艺术风格的葡萄酒风味雷达图海报,展示五款经典葡萄酒:Cabernet Sauvignon、Pinot Noir、Chardonnay、Riesling 和 Rosé 的味觉雷达图。五个六边形雷达图对称排列在中央装饰徽章周围。每个雷达图有六条轴线——酸度、单宁、甜度、酒体、果味、回味长度——填充半透明多边形展示…
-
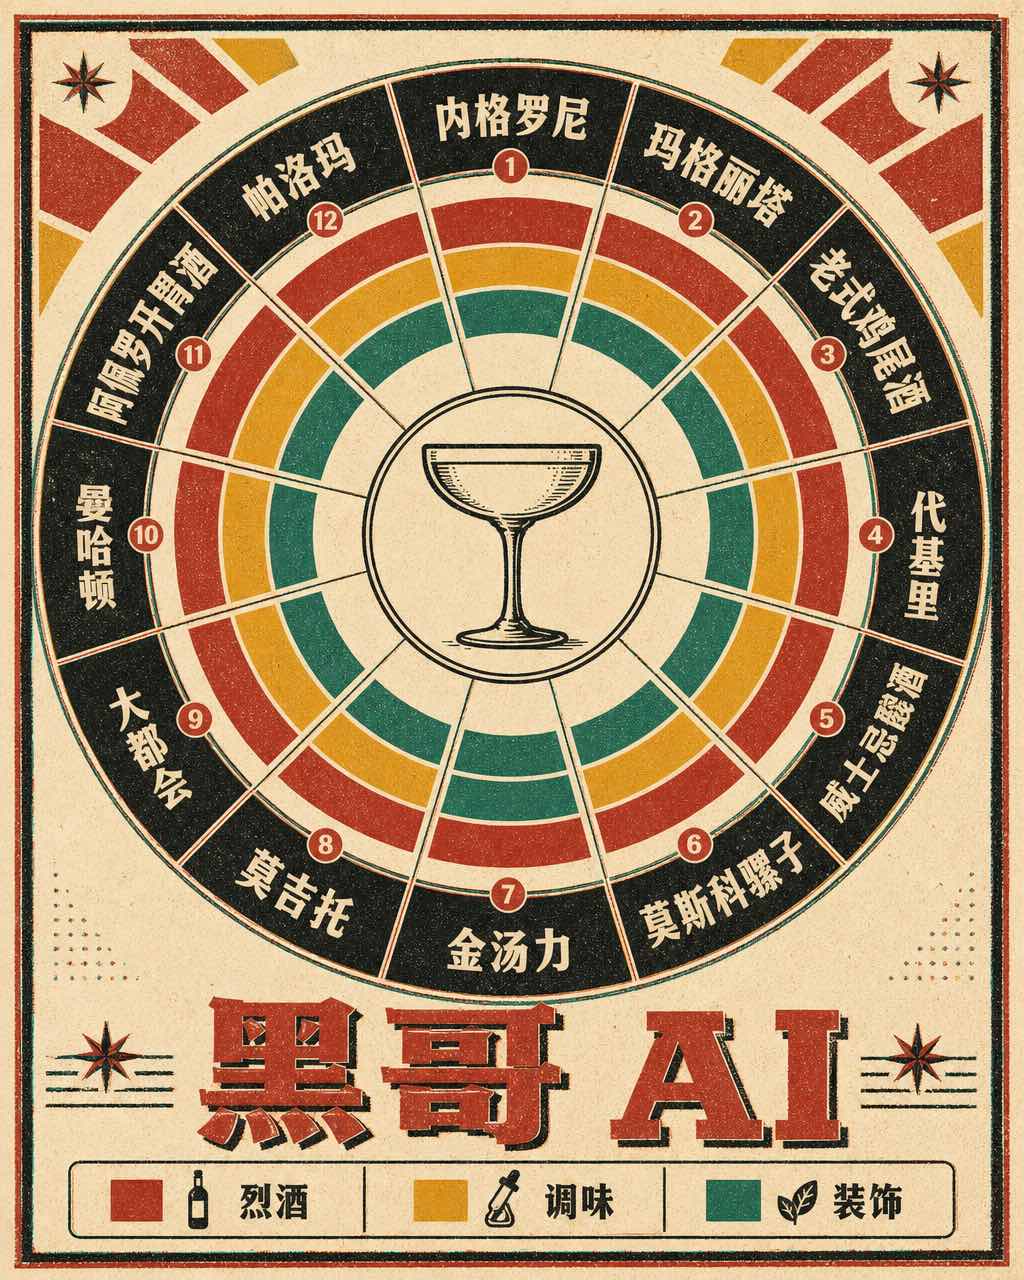
经典鸡尾酒配比转盘图
一张复古1960年代风格的圆形鸡尾酒配比转盘图,印在暖象牙色卡纸上,使用大胆的胶版印刷色彩。转盘分为十二个放射形扇区,每个代表一款经典鸡尾酒:Negroni、Margarita、Old Fashioned、Daiquiri、Whiskey Sour、Moscow Mule、Gin & Tonic、Mojito、Cos…