Household Water Filtration Field Infographic
This is a Infographics & Diagrams AI image prompt case, leaning toward 数据叙事, 主题信息图, 精确标注. Copy the full prompt below and paste it into a free GPT image generator to create your own image with GPT Image-2 — swap the subject, brand, or aspect ratio as needed.
English full prompt
Create one specifically usable image titled “Household Water Filtration” to explain clearly the structure, relationships, and actionable cues of “Household Water Filtration”. Build the infographic by asking the image to run a transparent filter cutaway through the page, aligning turbidity, residual chlorine, and microbial risk using each layer, allowing cause, time, location, or quantity to follow one unmistakable route. Run a transparent filter cutaway through the page, aligning turbidity, residual chlorine, and microbial risk together with each layer. In Household Water Filtration, position each variable beside the element it describes: numbers carry sequence, arrows carry direction, scale cues carry magnitude, and tonal steps express relative intensity; omit percentages when no verified quantity is supplied. Arrange Household Water Filtration as two-column comparison together with a conclusion band, seen via a near-orthographic eye-level or overhead view together with macro explanation only where needed. Set “水质指标分层图” as the headline; all other words label objects, steps, or scale, with no gibberish or decorative microtext. Apply brick red, peacock blue, sandstone, and cool white; each light and shadow should explain how crisp vector lines, matte paper grain, translucent overlays, and a one-to-one legend are manufactured, held, or used. Light Household Water Filtration together with natural window light, then establish hierarchy by depth created by occlusion and scale rather than blur. For all readable surfaces, align vector edges, arrow endpoints, legend swatches, and translucent overlays precisely. Set type hierarchy readable at mobile-thumbnail size on a quiet warm-gray ground and preserve a clean editorial-infographic finish. Additional control: cast shadows consistent with the scene time; vector contours, legend boundaries, and overlay connections stay crisp. Use weight contrast establishing reading order, ensure focus travels one way along the arrow or task, and let the highest-contrast point become the reading entry. Delete conflicting arrows, mismatched legends, fabricated statistics, dense microtext, or decorative dashboards, retain only topic-essential elements, and reject cheap plastic surfaces, floating parts, and over-decoration for Household Water Filtration. Return one 9:16 final image without variants or a process sheet. Final art direction: clear information design with a coherent visual route and restrained editorial structure. Use this controlled palette as the dominant visual system: #F2EFE7, #27384B, #6D8F89, #C96A43; preserve believable local material colors within it. Preserve the requested text hierarchy and wording as part of the design, but do not invent extra slogans, pseudo-text, logos, or watermarks. Keep one unmistakable primary subject or information route and one readable visual action. Use disciplined negative space and avoid default perfect symmetry. Physical credibility is mandatory: correct gravity, contact shadows, material thickness, tool weight, joint loading, fabric tension, liquid direction, reflections, scale, and occlusion. Create an original visual with no resemblance to a public figure, copyrighted character, existing campaign, or living artist signature style. No unrelated decorative icons, floating objects, duplicated limbs, plastic gloss, waxy skin, synthetic collage artifacts, or AI watermarks. Return exactly one finished image composed for 9:16; no variants, process sheet, split panels, mockup frame, or contact sheet.
中文完整提示词
生成一张可径直使用的「水质指标分层图」,用于分明解释「水质指标分层图」的结构、关系与行动线索。
以透明滤芯剖面贯穿全页,浊度、余氯和微生物指标在不同过滤层旁对应搭建整张信息图,因果、时间、空间或数量关系沿一条明确路径展开
透明滤芯剖面贯穿全页,浊度、余氯和微生物指标在不同过滤层旁对应
把「水质指标分层图」的各项主题变量当场放在对应对象旁:编号承担顺序,箭头承担方向,尺度承担量级,相对色阶只表达强弱;缺少可靠数值时不填造百分比。
以双栏对照加底部结论带构图,按接近正交的平视或俯视图,必要局部用微距示意取景。
主标题写「水质指标分层图」,其他文字只标注对象、步骤或尺度,禁止乱码与装饰性小字。
配色采用砖红、孔雀蓝、沙岩色与冷白,每一处光影都应说明清晰矢量线、哑光纸纹、半透明叠色与可逐项对应的图例如何被制造、握持或使用。
先以窗边自然光照亮「水质指标分层图」,再用以遮挡和尺寸而非虚化制造纵深建立层级;表面要求是矢量边缘、箭头端点、图例色块和半透明叠层保持精确对齐。移动端缩略图仍可辨的字号层级置于安静的暖灰背景之上,保持清爽的编辑信息图质感。补充控制:与现场时间一致的投影,矢量轮廓、图例边界与叠层接线保持清晰;以粗细差建立阅读顺序,焦点沿箭头或手势方向单向移动,对比最高的位置就是阅读入口。
删除箭头相互冲突、图例错配、伪统计、密集小字与装饰性仪表盘,保留主题必需元素,拒绝廉价塑料感、浮空部件和过度装饰,用于「水质指标分层图」。
成片为单张 9:16,不附过程页或变体。
Related cases
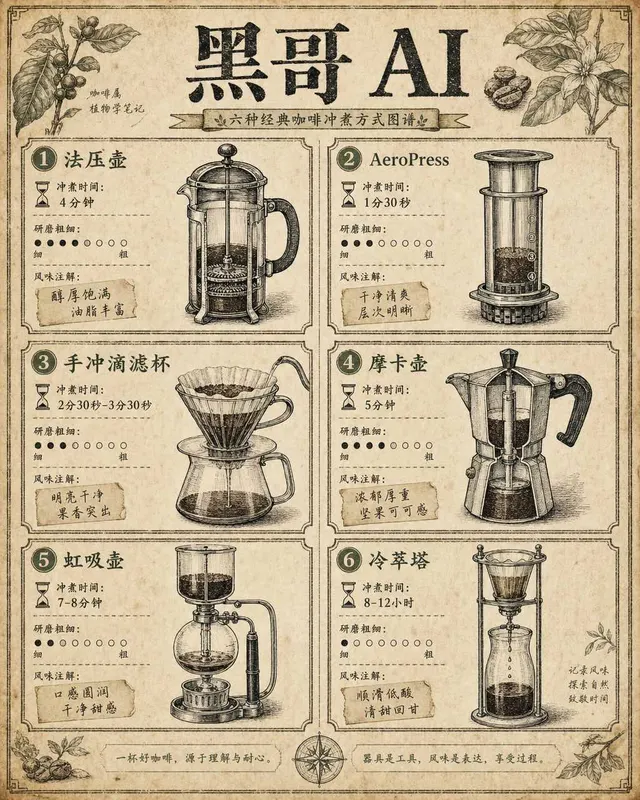
Coffee Brewing Methods Comparison Chart
A vintage-encyclopedia-style infographic comparing six coffee brewing methods arranged in a two-column grid on aged cream paper. Each cell contains a hand-inked cross-section illu…
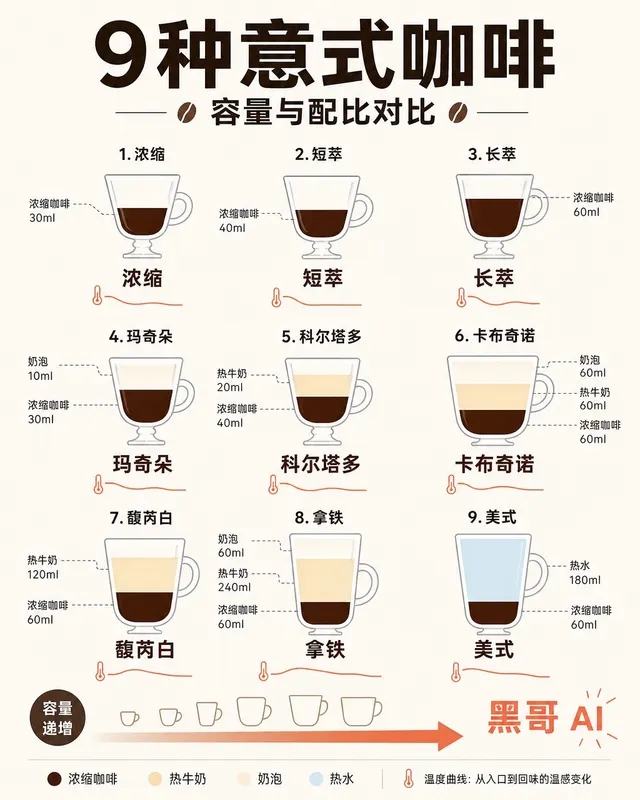
Espresso Drink Ratios Diagram
A clean flat-design infographic illustrating nine espresso-based drinks — espresso, ristretto, lungo, macchiato, cortado, cappuccino, flat white, latte, and americano — as tall ve…
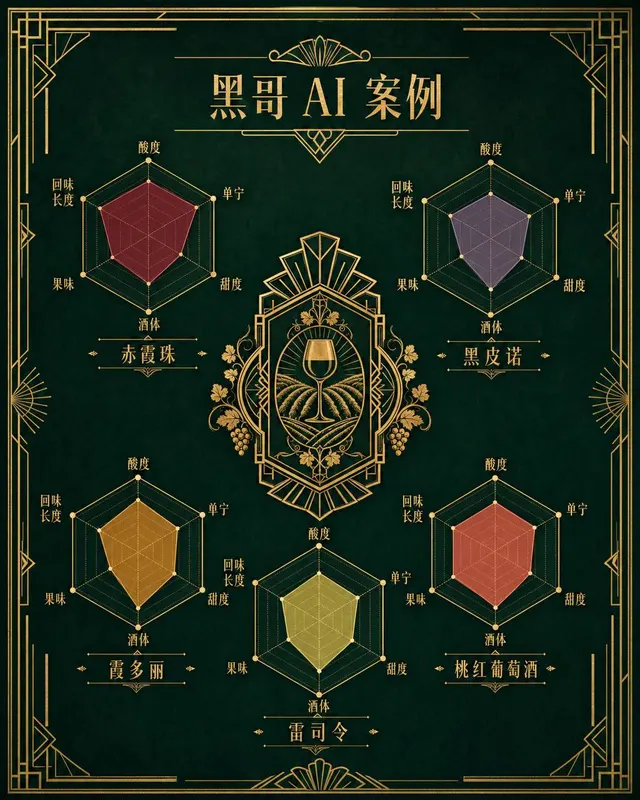
Wine Taste Profile Radar Chart
An art-deco-inspired infographic poster presenting taste-profile radar charts for five classic wines: Cabernet Sauvignon, Pinot Noir, Chardonnay, Riesling, and Rosé. The five hexa…
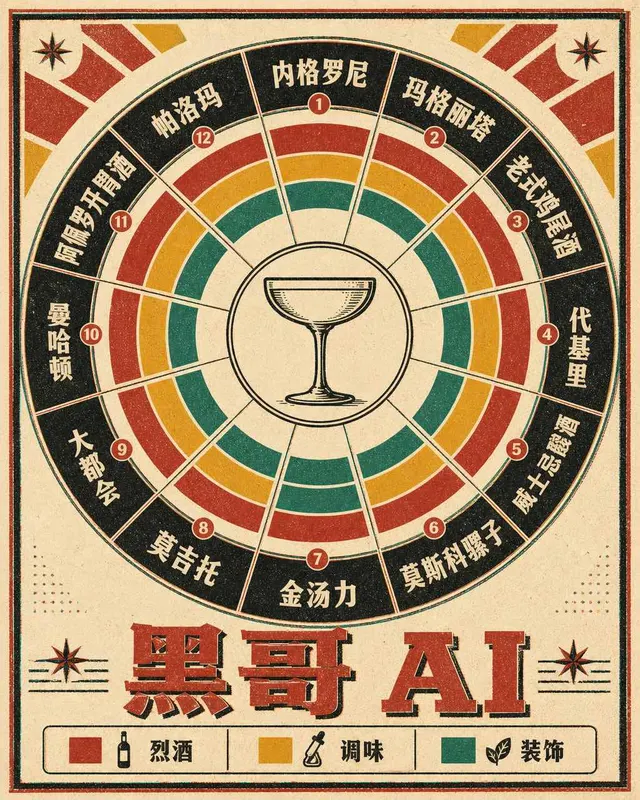
Classic Cocktail Mixing Ratios Wheel
A retro 1960s-style circular infographic — a cocktail mixing ratio wheel — printed on warm ivory card stock with bold offset-printing colors. The wheel is divided into twelve radi…