Exoplanet Atmosphere Transmission Spectrum
English full prompt
A clean astrophysics data-visualisation figure showing a simulated transmission spectrum of a super-Earth exoplanet atmosphere, styled like a panel from a Nature Astronomy paper. The main chart is a scatter plot with error bars: the x-axis is labelled "Wavelength (μm)" spanning 0.5 to 5.0, the y-axis is "Transit Depth (ppm)". Data points are small filled circles with vertical error bars in dark charcoal. A smooth model spectrum curve overlays the data in cobalt blue. Coloured shaded bands highlight molecular absorption features: water vapour (H₂O) in pale blue at 1.4 μm and 1.9 μm, carbon dioxide (CO₂) in pale red at 2.7 μm and 4.3 μm, methane (CH₄) in pale green at 3.3 μm. Each band is annotated with the molecule name. A miniature planetary transit geometry diagram appears as an inset at upper-right: a small blue planet silhouette crossing in front of a large orange star, with light rays indicated. Background: white publication background. Tick marks on axes are outward-pointing. Caption font 9 pt. The overall figure should look like it was produced in Python's matplotlib with a Nature stylesheet.
中文完整提示词
一张天体物理数据可视化图,模拟超地球系外行星大气透射光谱,仿 Nature Astronomy 论文图表风格。主图为带误差棒的散点图:x 轴 "Wavelength (μm)"(0.5–5.0),y 轴 "Transit Depth (ppm)";暗炭灰数据点,钴蓝平滑模型曲线叠加;淡蓝色带标注 H₂O(1.4/1.9 μm),淡红带标注 CO₂(2.7/4.3 μm),淡绿带标注 CH₄(3.3 μm)。右上角插图:小蓝行星轮廓凌日大橙恒星,光线示意。白色背景,坐标轴外向刻度,9pt 说明字体,matplotlib Nature 样式风格。
Related cases
-
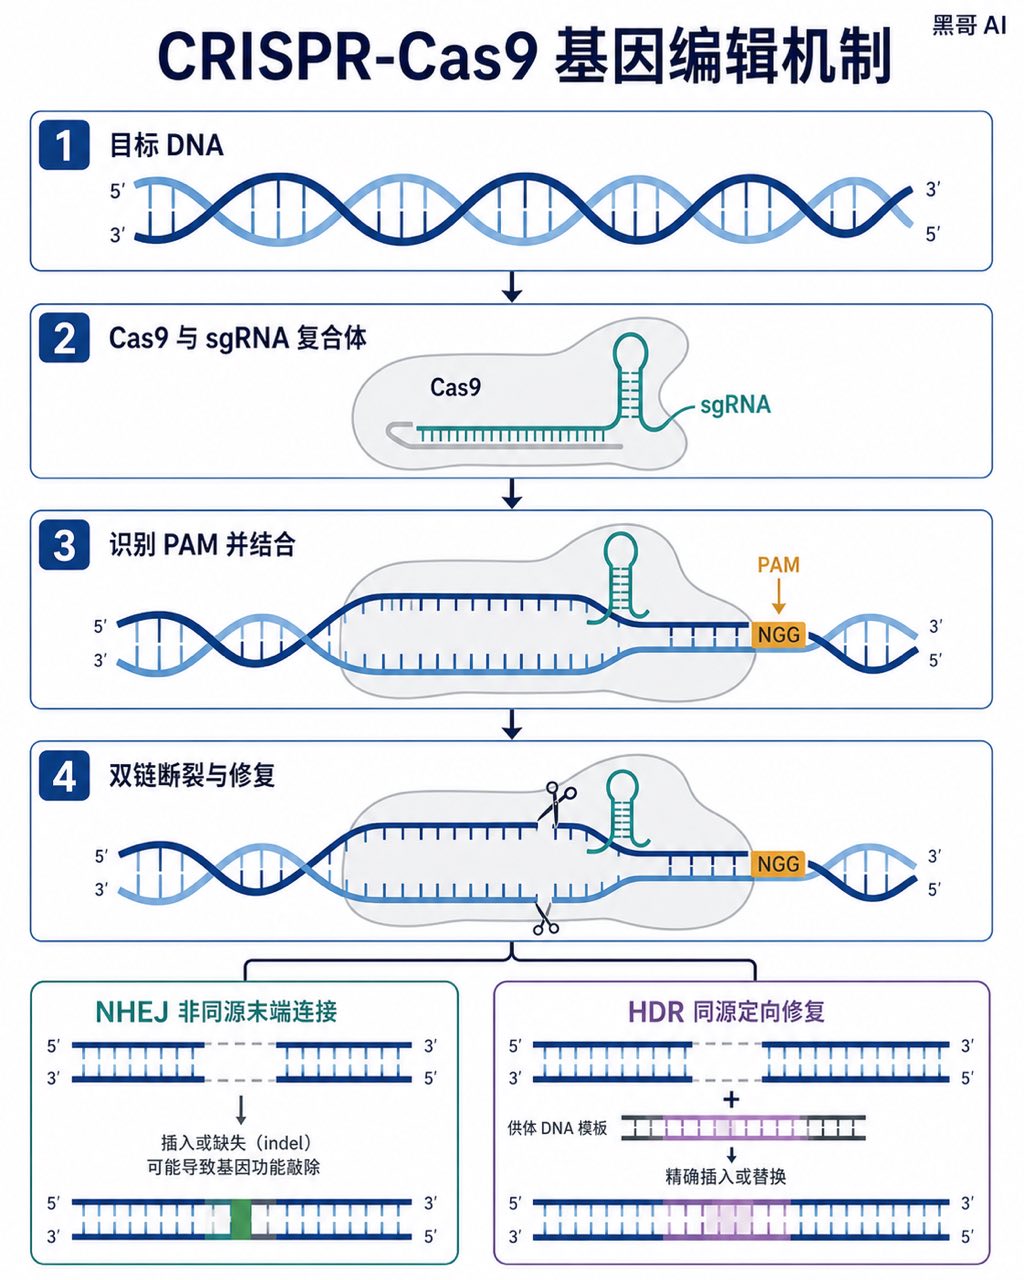
CRISPR-Cas9 Gene Editing Mechanism
A Nature-journal-quality flat vector diagram illustrating the CRISPR-Cas9 gene-editing mechanism. The composition is horizontal, spanning roughly A4 landscape, divided into four s…
-
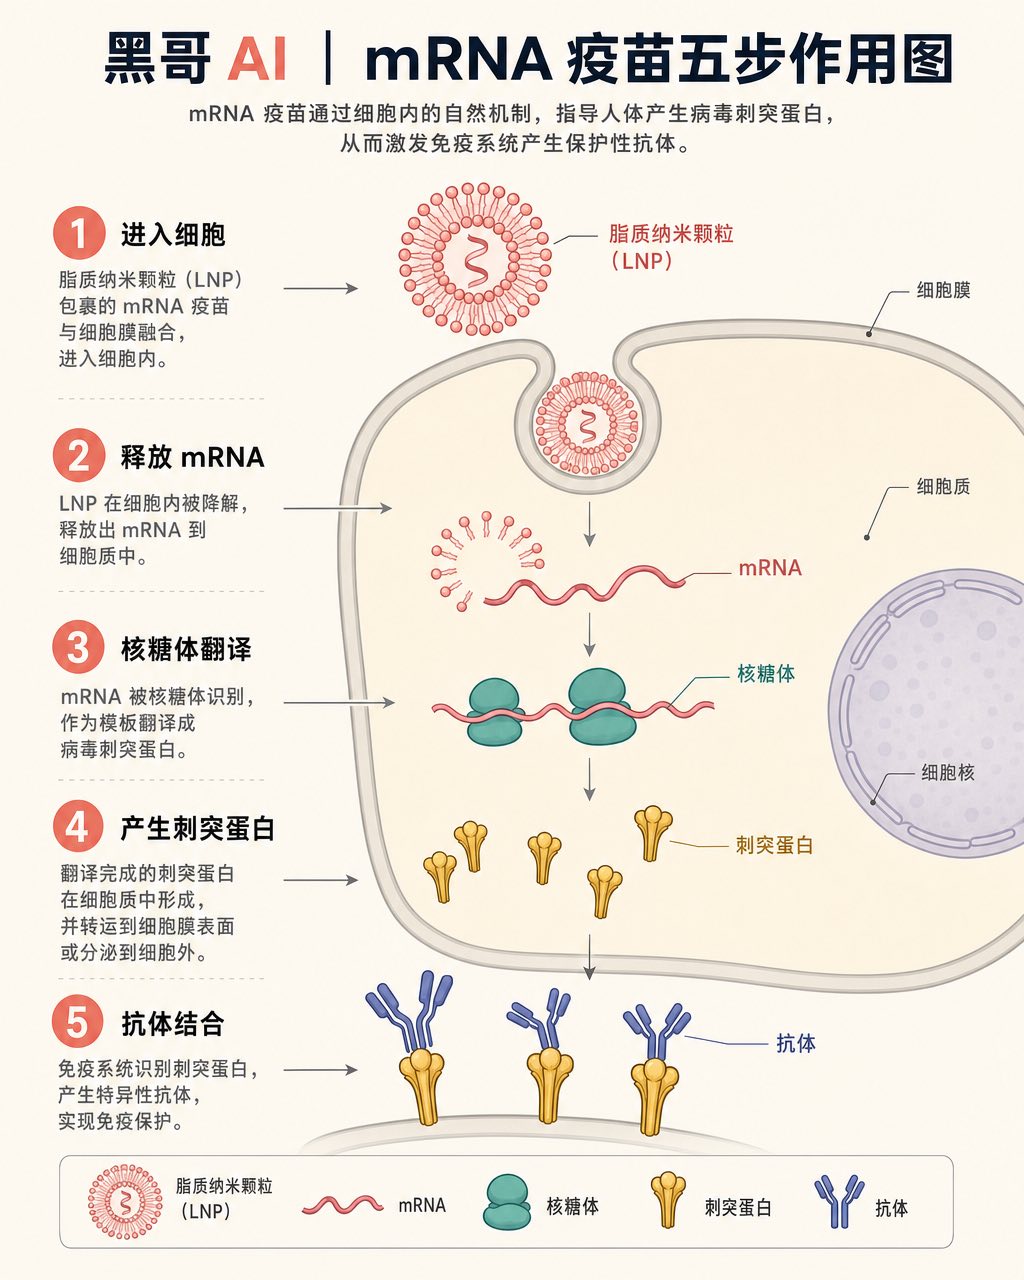
mRNA Vaccine Cellular Action
A textbook-flat isometric infographic showing the step-by-step action of an mRNA vaccine inside a human cell. The scene is rendered in a soft clinical palette: off-white backgroun…
-
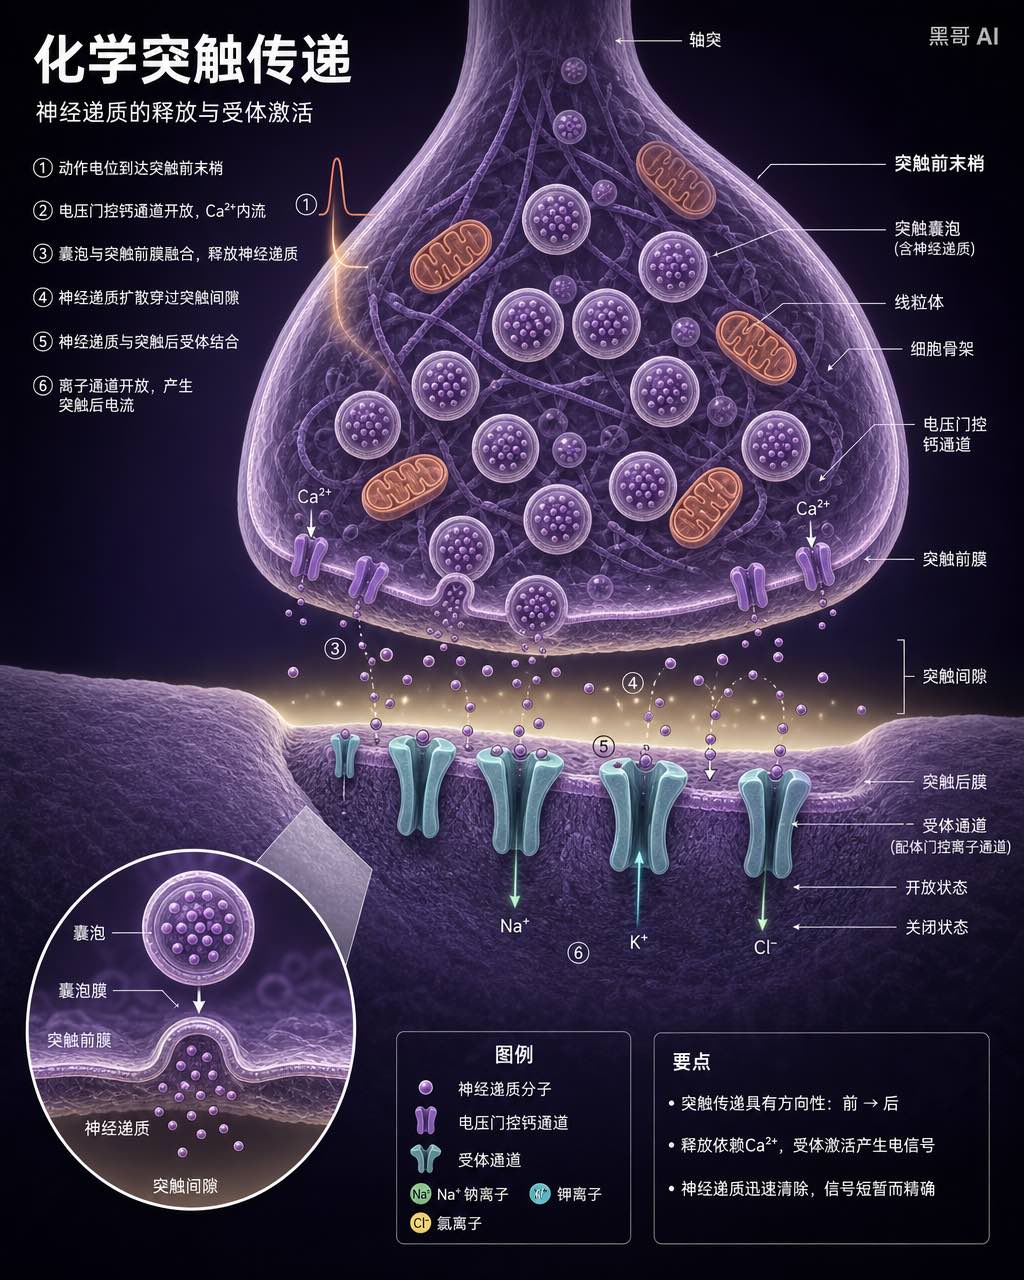
Neuron Synapse Cross-Section
A precise anatomical cross-section illustration of a chemical synapse between two neurons, rendered in the style of a high-end neuroscience textbook. Viewpoint: close-up transvers…
-
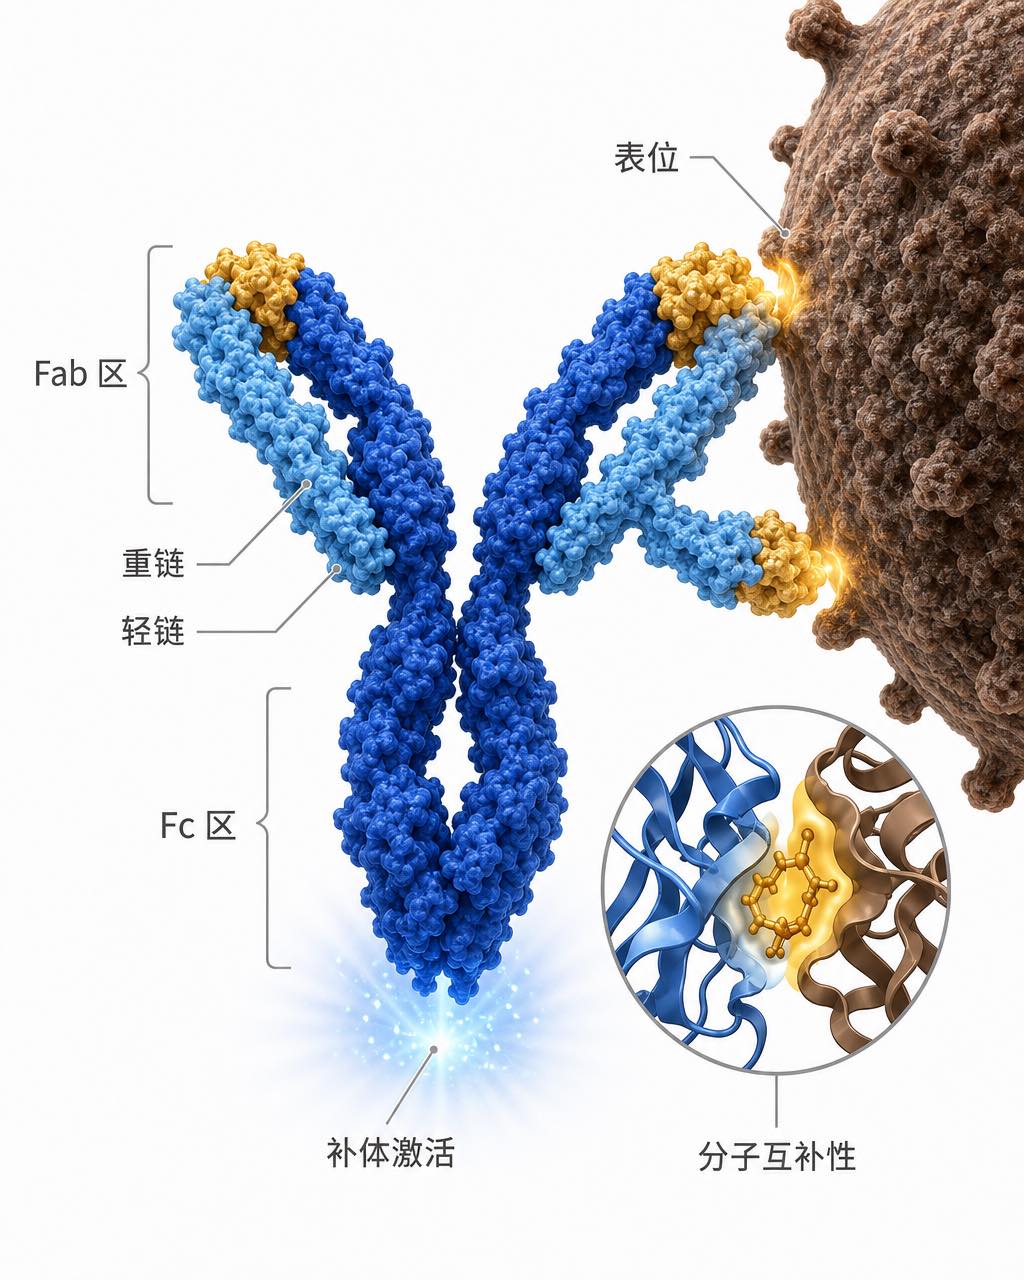
Antibody-Antigen Binding Diagram
A clean scientific illustration of an IgG antibody binding to a surface antigen on a pathogen, suitable for an immunology lecture slide. The antibody is rendered in a semi-3D ribb…