DNA Microarray Gene Expression Heatmap
This is a Scientific & Academic Figures AI image prompt case, leaning toward Flat, Minimalist. Copy the full prompt below and paste it into a free GPT image generator to create your own image with GPT Image-2 — swap the subject, brand, or aspect ratio as needed.
English full prompt
A gene expression heatmap figure in the style of a Genome Biology or Molecular Cell paper supplementary figure. The main panel is a 20 × 12 grid of square cells representing 20 genes (rows, labelled with fictional gene symbols on the y-axis: GFAB1, PROX2, NCDM3, SYKL4, RHTP5, etc.) across 12 experimental conditions (columns, labelled on the x-axis: "Ctrl-1", "Ctrl-2", "Ctrl-3", "Treat-A-1" through "Treat-A-3", "Treat-B-1" through "Treat-B-3", "Treat-C-1" through "Treat-C-3"). Cell colour encodes expression level using a diverging palette: deep navy blue for strong downregulation (log₂FC = −3), white for no change (0), and deep crimson for strong upregulation (+3). A vertical colour bar legend on the right is labelled "log₂ Fold Change" with a continuous gradient from navy to white to crimson and tick marks at −3, −1.5, 0, +1.5, +3. A dendrogram on the left y-axis (thin black branching lines) clusters the genes by expression profile similarity. A horizontal dendrogram on the top x-axis clusters conditions. Three coloured column-group brackets above the top dendrogram label "Control" (grey), "Treatment A" (teal), "Treatment B" (coral), "Treatment C" (gold). Black thin grid lines between cells at 0.5 pt. All axis labels in 8 pt, title label "Differentially Expressed Genes (n=20)" in 10 pt bold at the top. White background.
中文完整提示词
一张基因组学期刊附图风格的基因表达热图,主面板为 20×12 格子:20 个基因(行,y 轴标虚构基因符号 GFAB1、PROX2、NCDM3 等)×12 实验条件(列,x 轴标 "Ctrl-1/2/3"、"Treat-A-1/2/3"、"Treat-B-1/2/3"、"Treat-C-1/2/3")。颜色编码 log₂FC:深海军蓝(−3 下调)、白色(0)、深深红(+3 上调)。右侧竖向颜色条图例 「Ctrl-1」,刻度 −3/−1.5/0/+1.5/+3。左侧基因聚类树状图,顶部条件聚类树状图,顶部三色括号分组 「Ctrl-2」(灰)、「Ctrl-3」(青绿)、「Treat-A-1」(珊瑚)、「Differentially Expressed Genes (n=20)」(金色)。0.5pt 细黑格线,8pt 轴标,顶部 10pt 粗体标题 "Differentially Expressed Genes (n=20)",白色背景。
Related cases
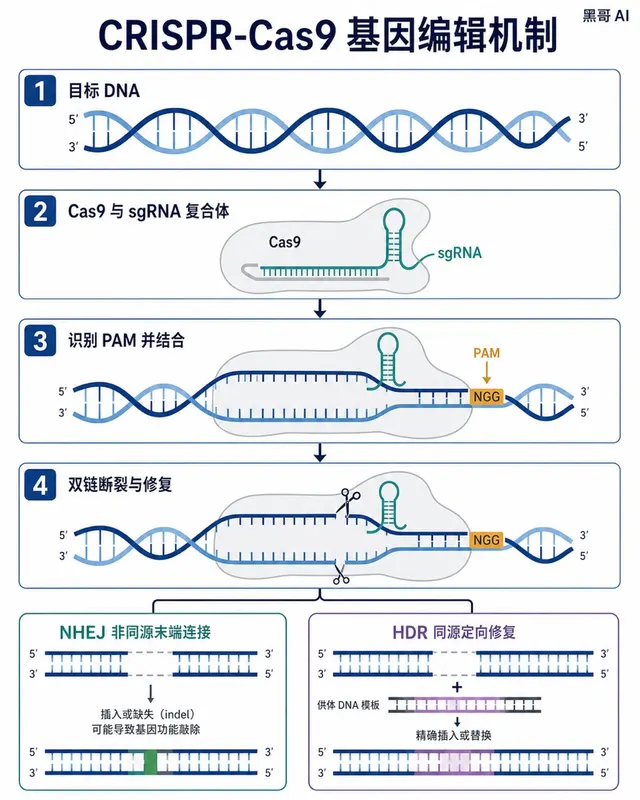
CRISPR-Cas9 Gene Editing Mechanism
A Nature-journal-quality flat vector diagram illustrating the CRISPR-Cas9 gene-editing mechanism. The composition is horizontal, spanning roughly A4 landscape, divided into four s…
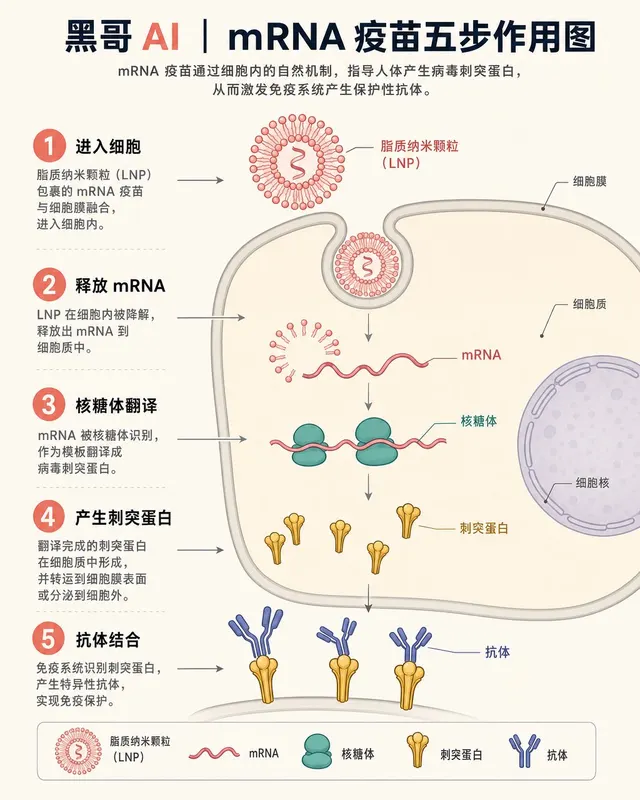
mRNA Vaccine Cellular Action
A textbook-flat isometric infographic showing the step-by-step action of an mRNA vaccine inside a human cell. The scene is rendered in a soft clinical palette: off-white backgroun…

Neuron Synapse Cross-Section
A precise anatomical cross-section illustration of a chemical synapse between two neurons, rendered in the style of a high-end neuroscience textbook. Viewpoint: close-up transvers…
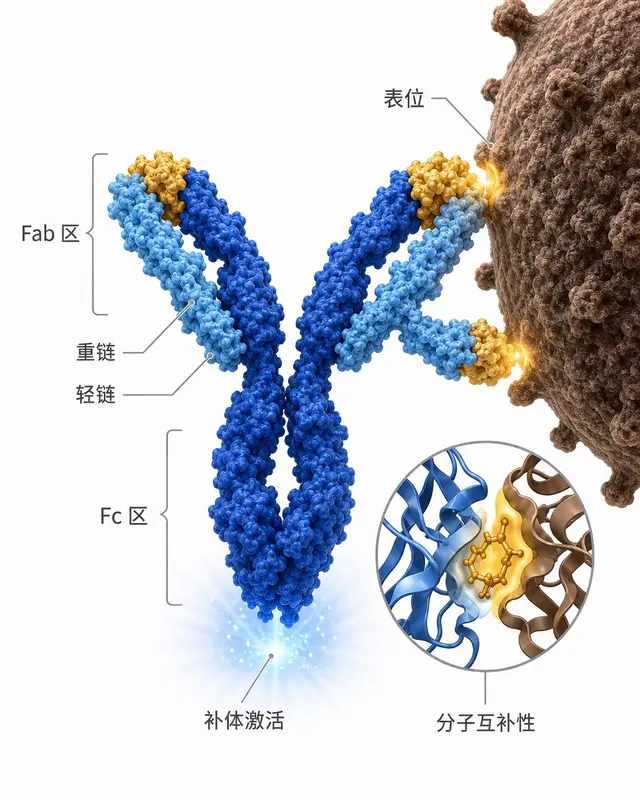
Antibody-Antigen Binding Diagram
A clean scientific illustration of an IgG antibody binding to a surface antigen on a pathogen, suitable for an immunology lecture slide. The antibody is rendered in a semi-3D ribb…