DNA 微阵列基因表达热图
这是一个「科研与学术图」类别的 AI 生图提示词案例,风格偏向扁平、极简主义。复制下方完整提示词,打开免费 GPT 生图工具粘贴,即可用 GPT Image-2 免费出图,并可替换主体、品牌名与画幅。
中文完整提示词
一张基因组学期刊附图风格的基因表达热图,主面板为 20×12 格子:20 个基因(行,y 轴标虚构基因符号 GFAB1、PROX2、NCDM3 等)×12 实验条件(列,x 轴标 "Ctrl-1/2/3"、"Treat-A-1/2/3"、"Treat-B-1/2/3"、"Treat-C-1/2/3")。颜色编码 log₂FC:深海军蓝(−3 下调)、白色(0)、深深红(+3 上调)。右侧竖向颜色条图例 「Ctrl-1」,刻度 −3/−1.5/0/+1.5/+3。左侧基因聚类树状图,顶部条件聚类树状图,顶部三色括号分组 「Ctrl-2」(灰)、「Ctrl-3」(青绿)、「Treat-A-1」(珊瑚)、「Differentially Expressed Genes (n=20)」(金色)。0.5pt 细黑格线,8pt 轴标,顶部 10pt 粗体标题 "Differentially Expressed Genes (n=20)",白色背景。
English full prompt
A gene expression heatmap figure in the style of a Genome Biology or Molecular Cell paper supplementary figure. The main panel is a 20 × 12 grid of square cells representing 20 genes (rows, labelled with fictional gene symbols on the y-axis: GFAB1, PROX2, NCDM3, SYKL4, RHTP5, etc.) across 12 experimental conditions (columns, labelled on the x-axis: "Ctrl-1", "Ctrl-2", "Ctrl-3", "Treat-A-1" through "Treat-A-3", "Treat-B-1" through "Treat-B-3", "Treat-C-1" through "Treat-C-3"). Cell colour encodes expression level using a diverging palette: deep navy blue for strong downregulation (log₂FC = −3), white for no change (0), and deep crimson for strong upregulation (+3). A vertical colour bar legend on the right is labelled "log₂ Fold Change" with a continuous gradient from navy to white to crimson and tick marks at −3, −1.5, 0, +1.5, +3. A dendrogram on the left y-axis (thin black branching lines) clusters the genes by expression profile similarity. A horizontal dendrogram on the top x-axis clusters conditions. Three coloured column-group brackets above the top dendrogram label "Control" (grey), "Treatment A" (teal), "Treatment B" (coral), "Treatment C" (gold). Black thin grid lines between cells at 0.5 pt. All axis labels in 8 pt, title label "Differentially Expressed Genes (n=20)" in 10 pt bold at the top. White background.
相关案例
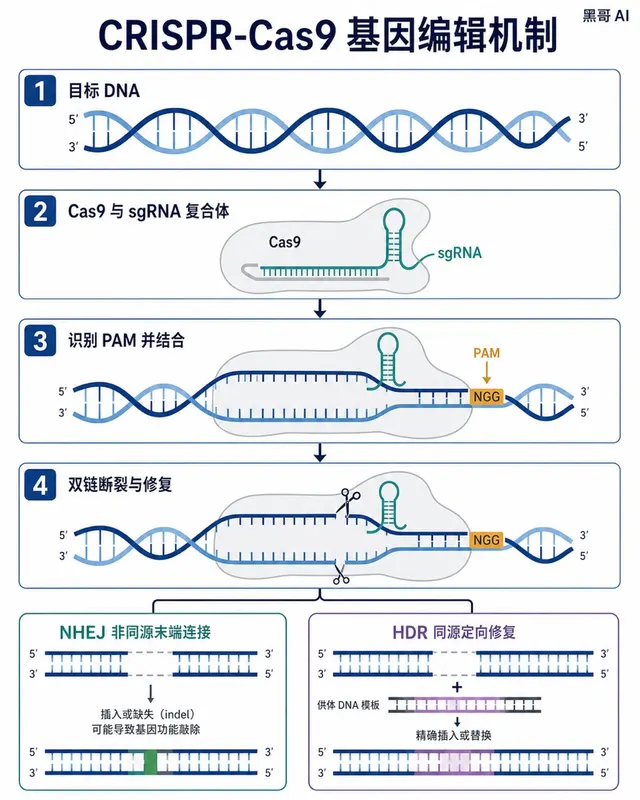
CRISPR-Cas9 基因编辑机制图
生成一张 4:5 竖版「CRISPR-Cas9 基因编辑机制图」案例图,所属分类为「科研与学术图」。四格扁平矢量图,展示 CRISPR-Cas9 切割 DNA 的全过程,深蓝螺旋、灰色 Cas9 蛋白、琥珀色 PAM 位点及红绿结果分支。画面需要完整呈现上述主体、构图、配色、材质、光线和整体风格;可见文字以自然简体中…
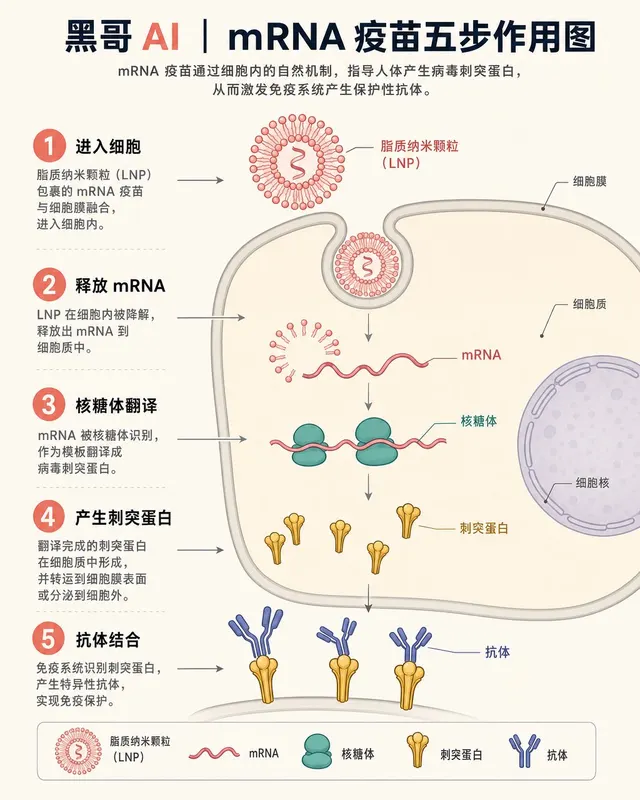
mRNA 疫苗细胞作用机制
一张教科书风格的等距信息图,展示 mRNA 疫苗在人体细胞内的分步作用。背景米白,脂质纳米颗粒(LNP)为珊瑚粉,核糖体为青绿色,刺突蛋白为金色。从 LNP 进入细胞膜,到 mRNA 释放、核糖体翻译刺突蛋白,再到靛蓝 Y 形抗体结合刺突蛋白,共五步,珊瑚色圆形数字徽章标注步骤,细箭头连接,无阴影扁平风格,适合 Sc…
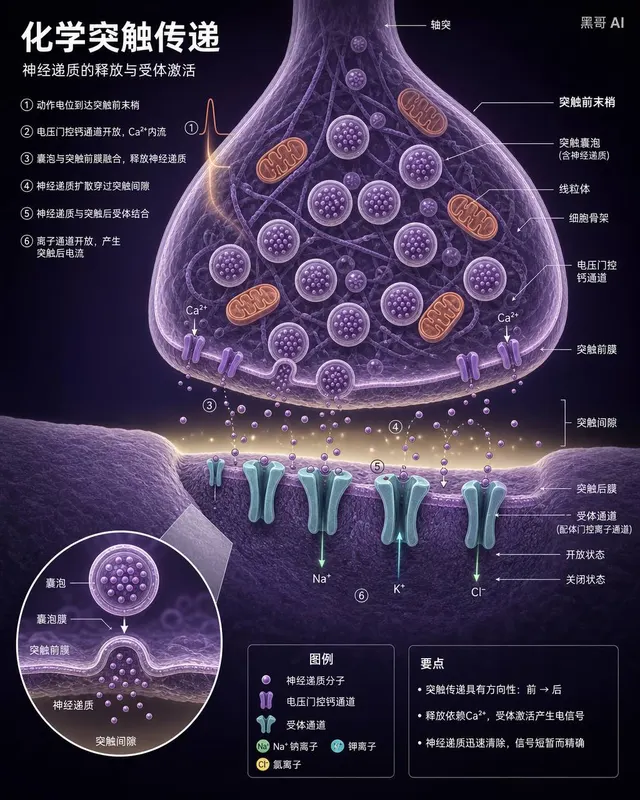
神经突触横截面图
一张高端神经科学教科书风格的化学突触横截面图。上半部为突触前末梢,布满淡紫色囊泡(内含神经递质小点)与暖橙色线粒体;突触间隙为极淡黄色细缝,神经递质分子飞渡其中;下半部突触后膜嵌有青绿色 Y 形受体通道,部分开放部分关闭,标注微小离子流箭头。小圆形插图放大一个囊泡融合事件。深紫背景,细领线标注,9pt Helveti…
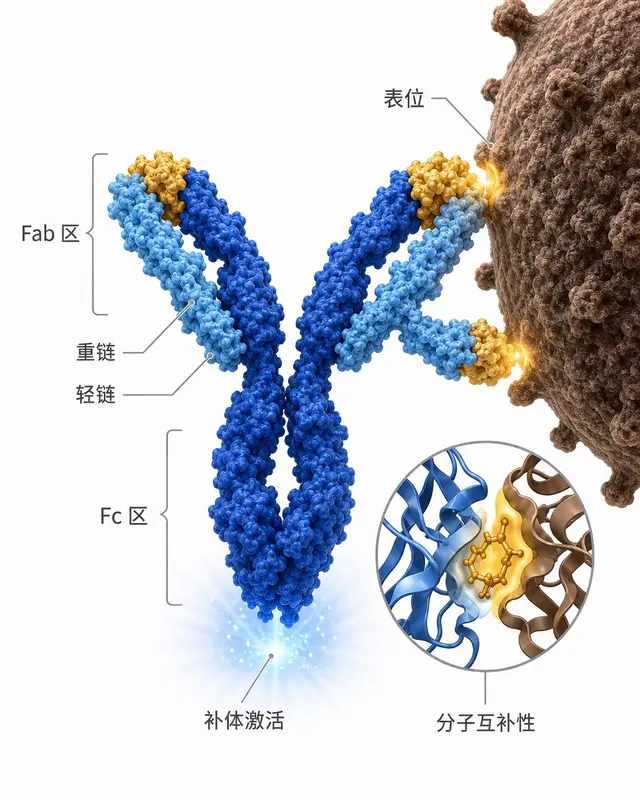
抗体-抗原结合免疫图
一张免疫学讲义风格的 IgG 抗体结合抗原示意图。深钴蓝重链与天蓝轻链构成经典 Y 形,Fab 区末端与病原体(棕褐色粗糙衣壳弧面)上的表位形成锁-钥结合。Fc 区底部微发光暗示补体激活。右下角圆形插图以 ribbon-diagram 风格展示一个结合口袋的分子互补性。白色背景,金色高亮结合区,细灰色领线标注,整洁无…