Global Climate Carbon Cycle
English full prompt
A broad landscape infographic of the global carbon cycle, drawn in a flat isometric-influenced style suitable for an IPCC report supplementary figure. The scene spans ocean (left), coastal zone (centre), and terrestrial ecosystem (right). Ocean: deep teal water with dissolved CO₂ shown as tiny grey dots, an upward flux arrow labelled "Ocean degassing" and a downward arrow labelled "Ocean uptake" with a number badge showing "−2.5 GtC/yr". Coastal zone: industrial port with a factory chimney emitting a CO₂ plume, labelled "Fossil fuel emissions +10 GtC/yr" in red. Terrestrial side: a simplified forest with photosynthesis downward arrow in green labelled "GPP −120 GtC/yr" and respiration upward arrow in orange; a soil layer with decomposition arrow; a deforestation clearcut area with an orange upward arrow labelled "Land-use change". Atmosphere: a light grey sky band at the top with a rising CO₂ concentration graph (small line chart in dark red) labelled "415 ppm → rising". Underground: sedimentary and fossil fuel reservoir shown as dark brown layers with coal and oil icons. Flux arrows are colour-coded: red = emissions, green = uptake, blue = ocean exchange. Bold number badges on each flux. Legend at lower-left.
中文完整提示词
一张横向全球碳循环信息图,IPCC 报告附图风格,平面等距混合风格。画面分三区:左侧深青绿海洋(溶解 CO₂ 灰点、「Ocean degassing」 上箭头和 "Ocean uptake −2.5 GtC/yr" 下箭头);中央工业港口(烟囱 CO₂ 烟柱,红色 "+10 GtC/yr" 标注);右侧森林(绿色 GPP 下箭头 "−120 GtC/yr"、橙色呼吸上箭头、土壤分解箭头、砍伐区土地利用变化上箭头)。顶部浅灰大气带含深红小折线图 「415 ppm → rising」。地下深棕沉积与化石燃料储层,煤炭和石油图标。通量箭头色码:红=排放、绿=吸收、蓝=海洋交换。各通量粗体数字徽章,左下图例。
Related cases
-
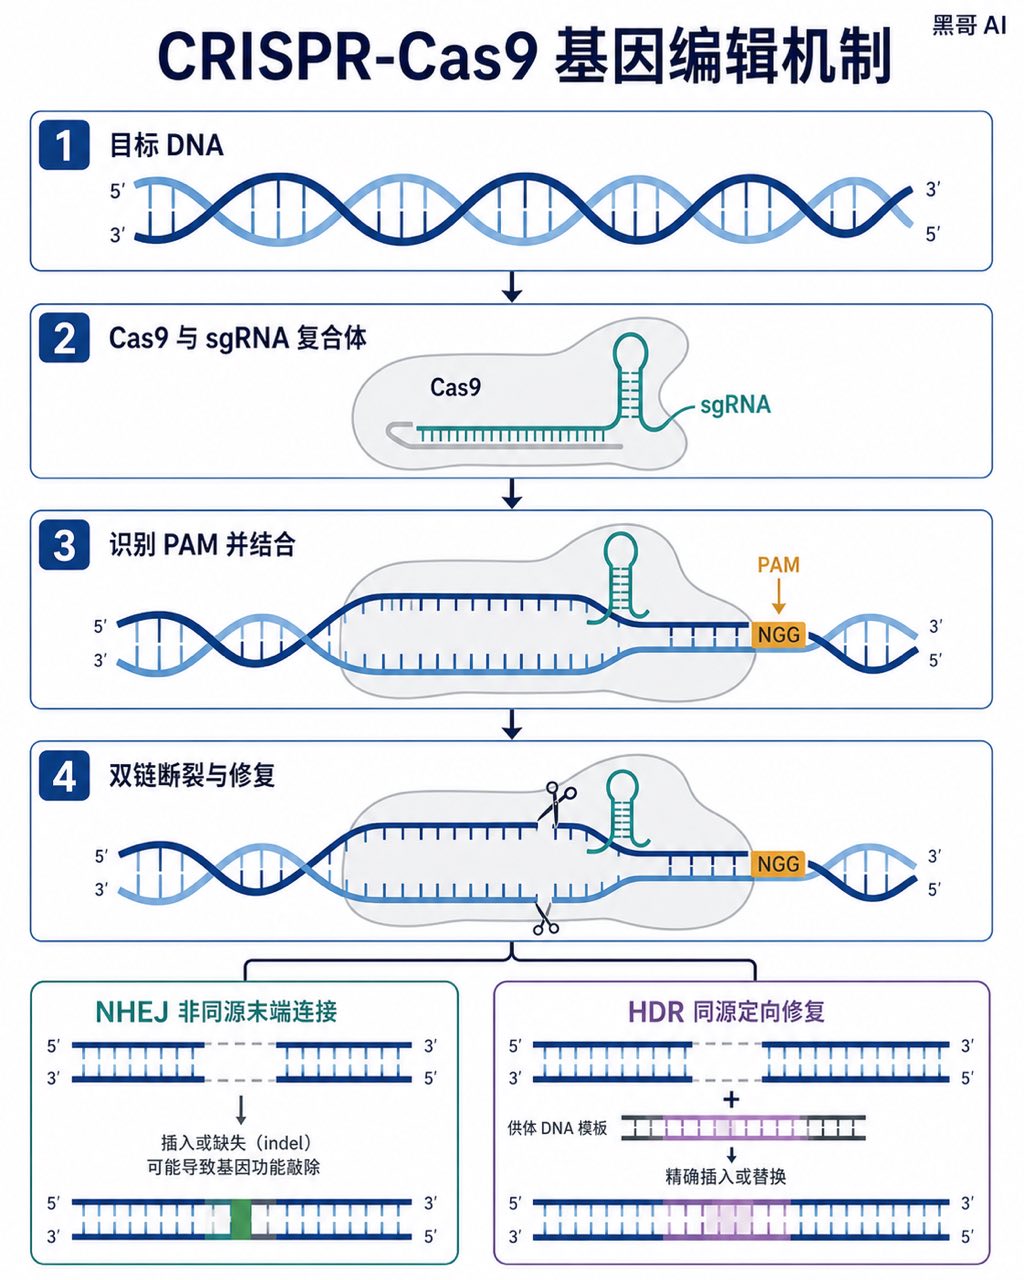
CRISPR-Cas9 Gene Editing Mechanism
A Nature-journal-quality flat vector diagram illustrating the CRISPR-Cas9 gene-editing mechanism. The composition is horizontal, spanning roughly A4 landscape, divided into four s…
-
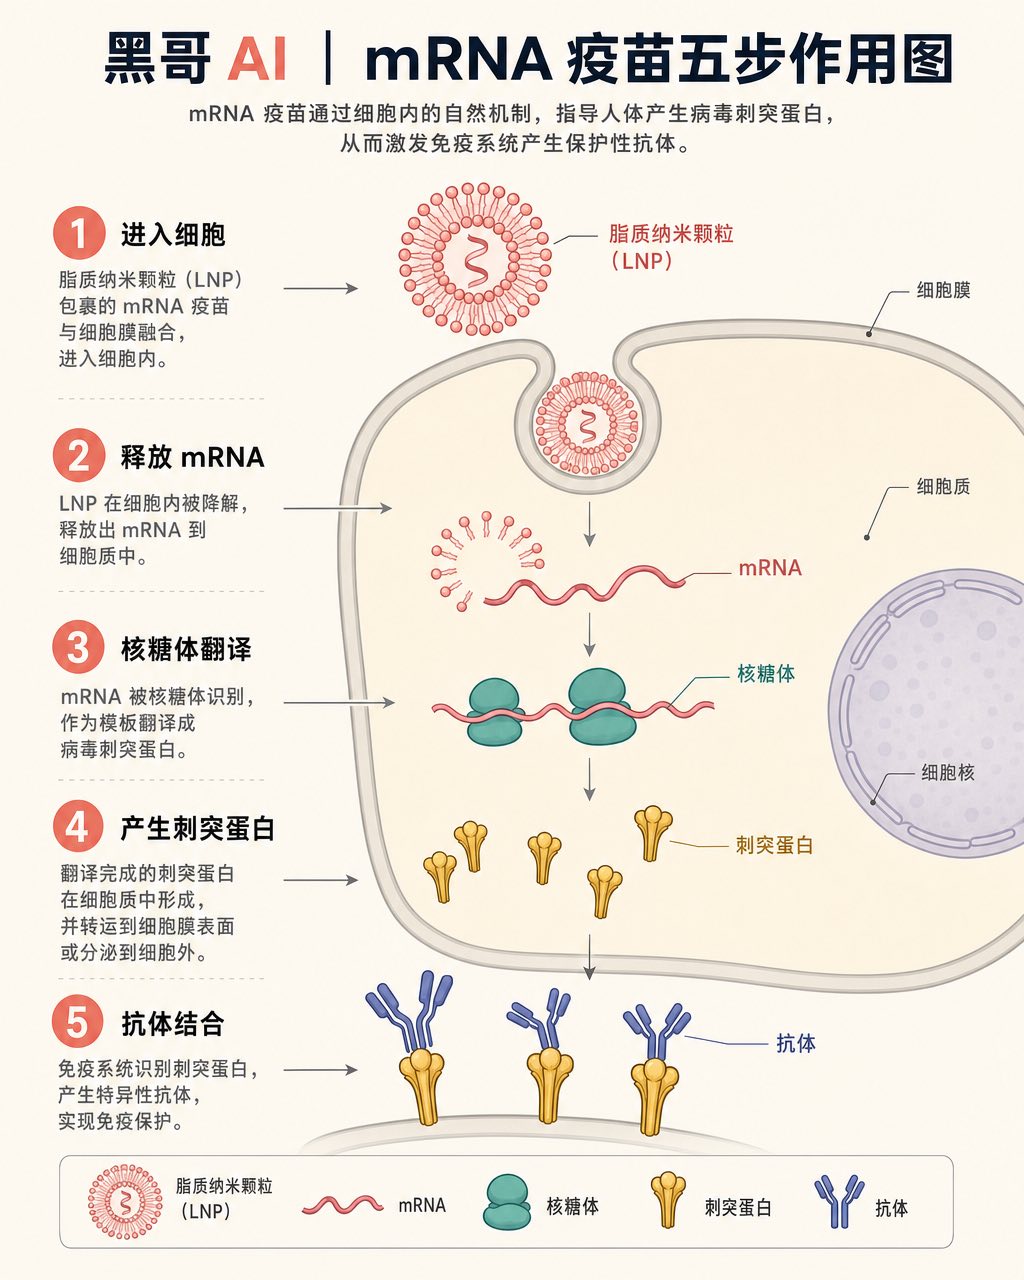
mRNA Vaccine Cellular Action
A textbook-flat isometric infographic showing the step-by-step action of an mRNA vaccine inside a human cell. The scene is rendered in a soft clinical palette: off-white backgroun…
-
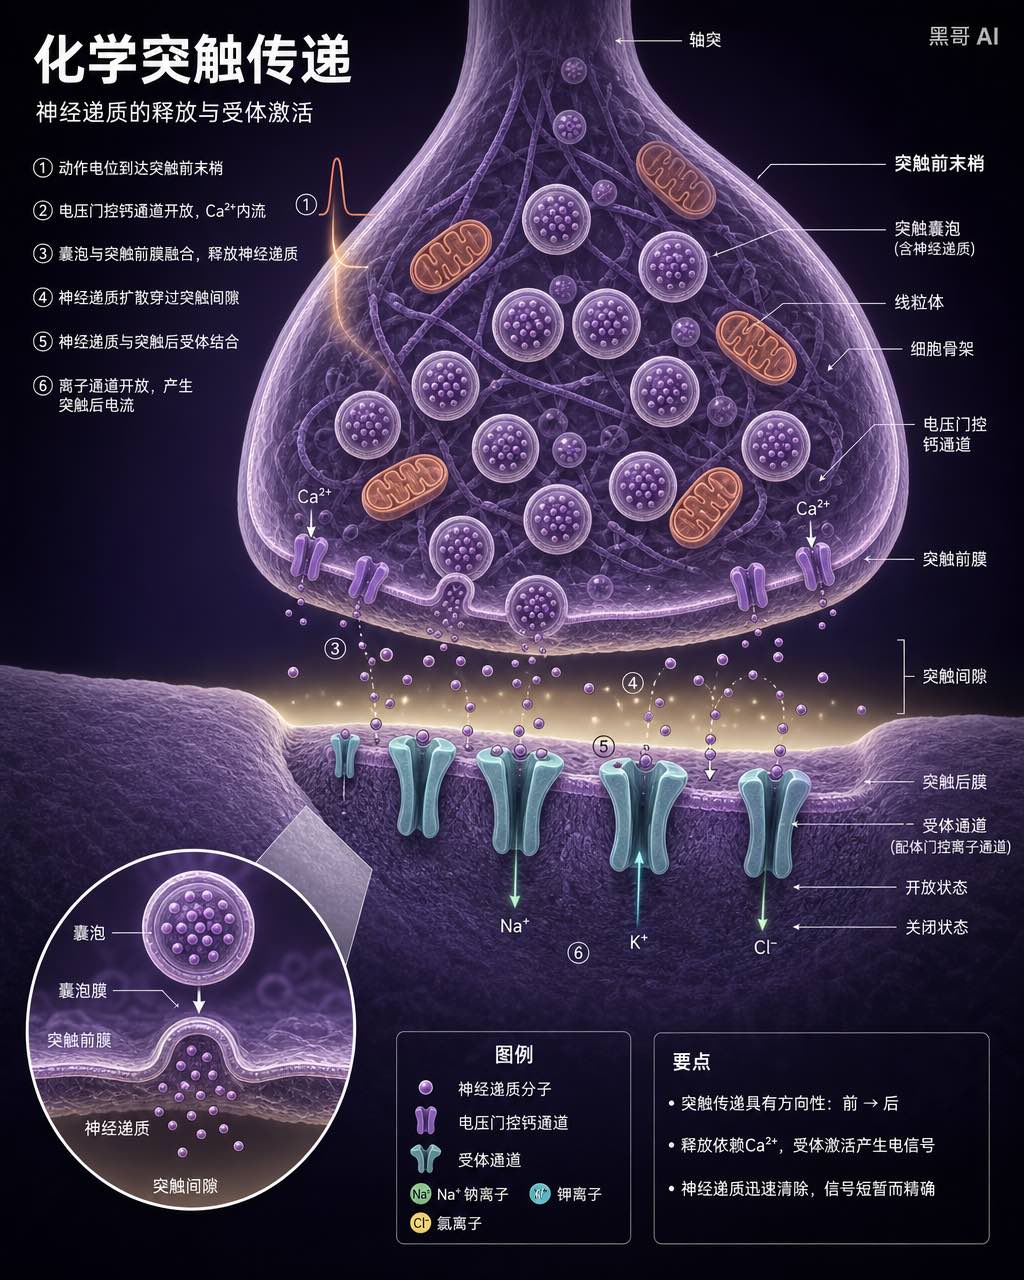
Neuron Synapse Cross-Section
A precise anatomical cross-section illustration of a chemical synapse between two neurons, rendered in the style of a high-end neuroscience textbook. Viewpoint: close-up transvers…
-
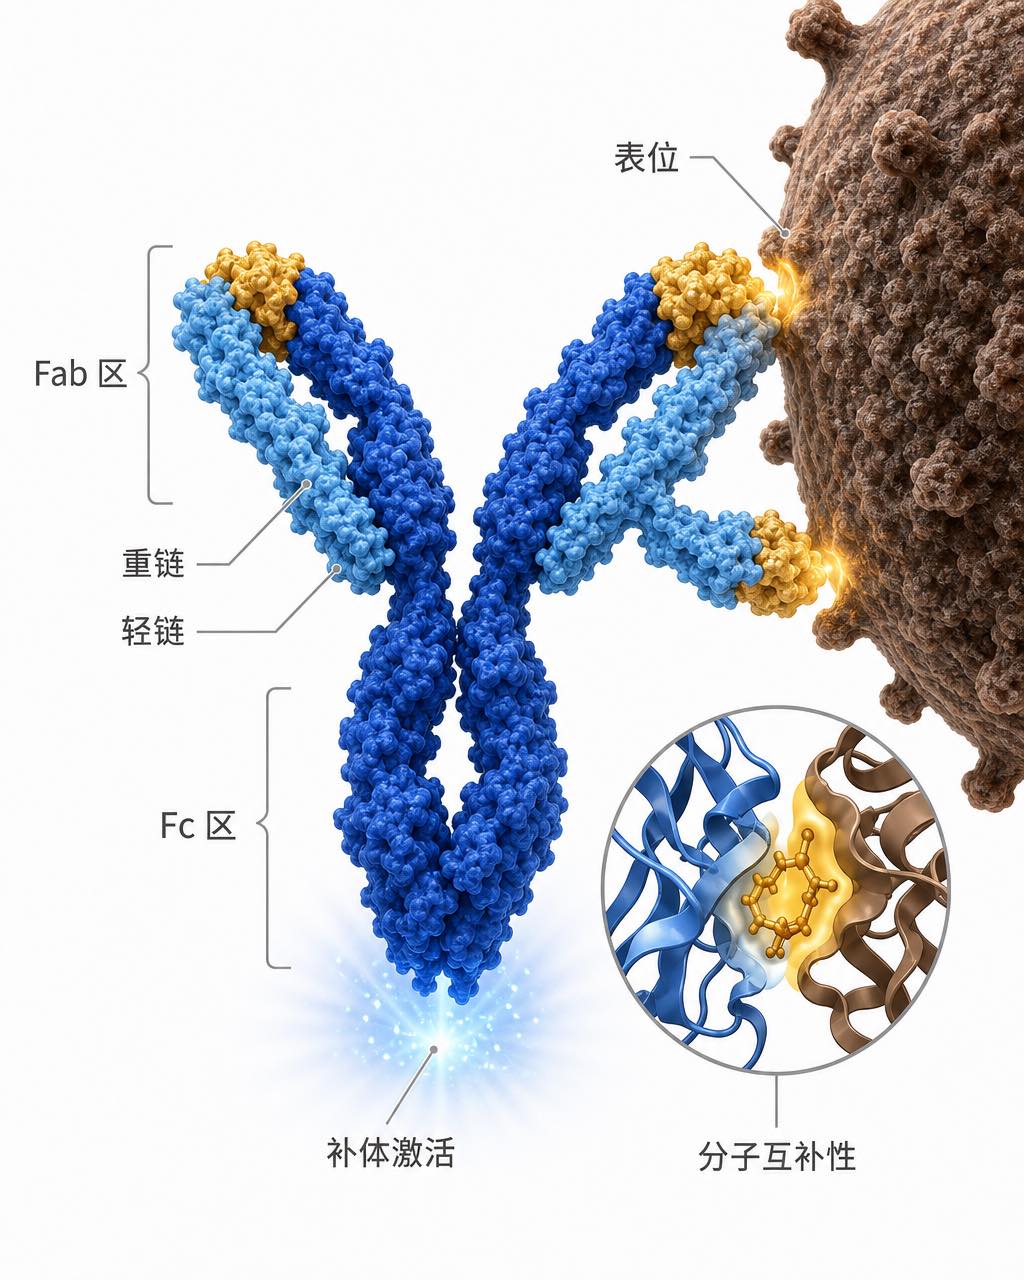
Antibody-Antigen Binding Diagram
A clean scientific illustration of an IgG antibody binding to a surface antigen on a pathogen, suitable for an immunology lecture slide. The antibody is rendered in a semi-3D ribb…