梯度下降损失曲面可视化
这是一个「科研与学术图」类别的 AI 生图提示词案例,风格偏向3D、扁平。复制下方完整提示词,打开免费 GPT 生图工具粘贴,即可用 GPT Image-2 免费出图,并可替换主体、品牌名与画幅。
中文完整提示词
一张机器学习模型非凸损失曲面的 3D 可视化,从左前上方俯瞰。网格曲面由冷到暖色渐变:深紫高损失山脊→钴蓝青绿鞍点→暖金亮黄绿谷底/全局最小值。曲面含一个尖锐全局最小值(中右深漏斗)、两个局部最小值(左侧浅碗)和一个鞍点。白色小球连线轨迹展示 SGD 路径:从左上高原出发,一度陷入局部最小值后逃出;珊瑚色第二条轨迹为自适应优化器路径,绕过局部最小直达全局最小。X 轴 「Parameter θ₁」,Y 轴 「Parameter θ₂」,Z 轴 "Loss ℒ(θ)"。图例标注白色 "SGD" 与珊瑚色 「Loss ℒ(θ)」。深炭黑背景,曲面悬浮感。
English full prompt
A dramatic 3D visualisation of a non-convex loss landscape for a machine learning model, viewed from a slightly elevated front-left perspective. The surface is a smooth parametric mesh rendered with a cool-to-warm colour gradient: deep violet for high-loss ridges, through cobalt blue and teal for saddle points, to warm gold and bright yellow-green for valleys and the global minimum. The surface shows one sharp global minimum (a deep narrow funnel) near the centre-right, two local minima (shallower bowls) in the left region, and a saddle point between two ridges. A gradient descent trajectory is shown as a series of small white spheres connected by a white path line, starting from the top-left plateau and descending via several steps — at one point it gets trapped in a local minimum for a few steps before escaping. A second trajectory in coral shows an adaptive optimiser path that avoids the local minimum and reaches the global minimum more efficiently. X-axis labelled "Parameter θ₁", Y-axis "Parameter θ₂", Z-axis "Loss ℒ(θ)". Small legend identifying the white path as "SGD" and coral path as "Adaptive Optimiser". Background: dark charcoal, giving the surface a floating appearance.
相关案例
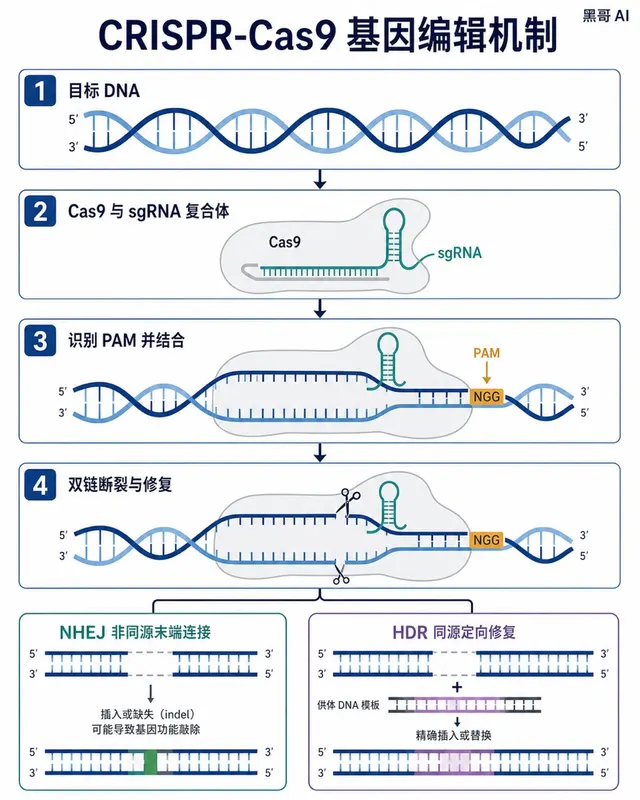
CRISPR-Cas9 基因编辑机制图
生成一张 4:5 竖版「CRISPR-Cas9 基因编辑机制图」案例图,所属分类为「科研与学术图」。四格扁平矢量图,展示 CRISPR-Cas9 切割 DNA 的全过程,深蓝螺旋、灰色 Cas9 蛋白、琥珀色 PAM 位点及红绿结果分支。画面需要完整呈现上述主体、构图、配色、材质、光线和整体风格;可见文字以自然简体中…
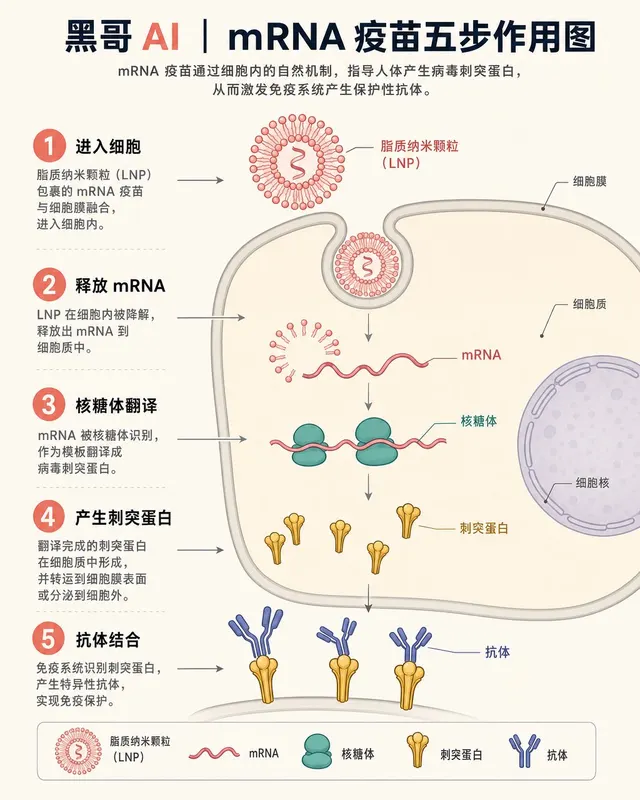
mRNA 疫苗细胞作用机制
一张教科书风格的等距信息图,展示 mRNA 疫苗在人体细胞内的分步作用。背景米白,脂质纳米颗粒(LNP)为珊瑚粉,核糖体为青绿色,刺突蛋白为金色。从 LNP 进入细胞膜,到 mRNA 释放、核糖体翻译刺突蛋白,再到靛蓝 Y 形抗体结合刺突蛋白,共五步,珊瑚色圆形数字徽章标注步骤,细箭头连接,无阴影扁平风格,适合 Sc…
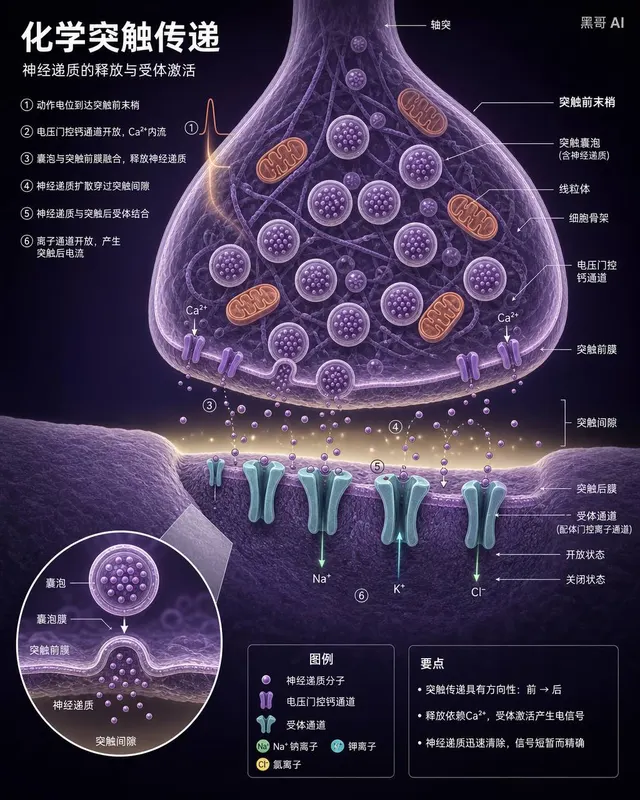
神经突触横截面图
一张高端神经科学教科书风格的化学突触横截面图。上半部为突触前末梢,布满淡紫色囊泡(内含神经递质小点)与暖橙色线粒体;突触间隙为极淡黄色细缝,神经递质分子飞渡其中;下半部突触后膜嵌有青绿色 Y 形受体通道,部分开放部分关闭,标注微小离子流箭头。小圆形插图放大一个囊泡融合事件。深紫背景,细领线标注,9pt Helveti…
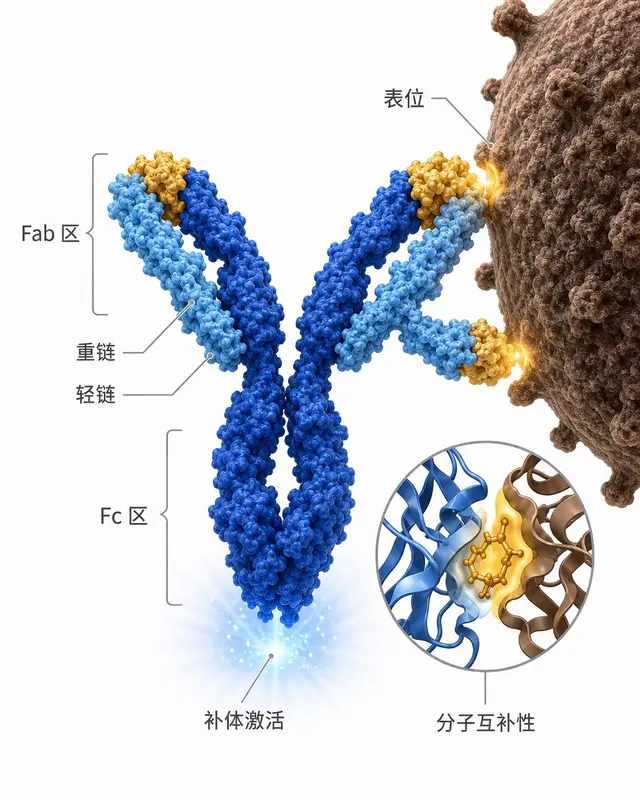
抗体-抗原结合免疫图
一张免疫学讲义风格的 IgG 抗体结合抗原示意图。深钴蓝重链与天蓝轻链构成经典 Y 形,Fab 区末端与病原体(棕褐色粗糙衣壳弧面)上的表位形成锁-钥结合。Fc 区底部微发光暗示补体激活。右下角圆形插图以 ribbon-diagram 风格展示一个结合口袋的分子互补性。白色背景,金色高亮结合区,细灰色领线标注,整洁无…